Blog
Visible Blog
Resources to support ambitious founders and the investors who back them.
All
Fundraising Metrics and data Product Updates Operations Hiring & Talent Reporting Customer Stories

founders
Metrics and data
SaaS Metrics Benchmarks
The SaaS industry has experienced rapid growth in recent years. With industry expansion comes expansion in all facets of the market. More data, resources, blog posts, thought leaders, ideas, than ever before. While there are great resources being shared on a daily basis there are also equally poor resources being shared on a daily basis. So do how you filter the signal from the noise? Why do SaaS Metrics matter and what should you be tracking?
SaaS companies are inherently driven by data and metrics so common SaaS metrics benchmarks and metrics are starting to become more common across the industry. With hundreds of venture firms focusing in SaaS, many have started to share their findings to continue to spur growth in the industry and increase the quality of early stage SaaS companies.
SaaS Metrics Benchmarks
Comparing your company to the others around you is one of the best ways to ensure that you are on the right track with your SaaS metrics. Being a SaaS startup founder can often feel like you’re alone in the journey so being able to stack up against other using SaaS metrics benchmarks is a must.
One of our favorite SaaS metrics benchmarks is the annual metrics benchmark from the team at OpenView ventures. We’ve partnered with OpenView to send their survey to 400+ SaaS companies on an annual basis. From here, the team takes a look at the data and uncovers underlying trends and directions in the market. We specifically love this SaaS benchmark because it shows vital SaaS metrics broken down by company size. It can be intimidating comparing your data to powerhouses like Slack or Salesforce so the OpenView SaaS metrics benchmarks allows you to compare yourself to companies at a similar stage.
Another great SaaS metrics benchmark is from Christoph Janz of Point Nine Capital. Every year, Christoph puts together a SaaS funding napkin. The napkin is a breakdown of SaaS metrics and benchmarks the data a company needs to hit to raise a seed, series A, series B, etc. Generally, Chrisoph uses revenue, team, product/market, sales/marketing, and the companies’ moat to benchmark what it takes to raise at different stages of a company lifecycle.
No matter what source you use, finding a quality SaaS metric benchmark will greatly help in your journey to scale the company. While no company or founder is the exact same, having a benchmark to turn to will help shine a light at the end of the tunnel.

founders
Metrics and data
Marketing Scores: Measuring Your Marketing Efficiency
The job of a marketer is to assist a sales team in generating new leads and in turn generating new customers. In order to measure the effectiveness in closing new customers teams have to implement marketing scores across the organization to measure and iterate on their efforts.
Marketing scores can be used across your sales and marketing funnel to improve conversions across the board and spur growth with small tweaks. Especially for a SaaS business, measuring your SaaS metrics and marketing scores can be easily replicated across the funnel and shared throughout your organization. You can check out the 3 marketing scores we suggest starting to track below:
Qualified Marketing Traffic
In its simplest form marketing traffic is anyone who has visited your website. The greater number of people who visit your website and are aware of your business the greater number of opportunities you have to produce customers. However, not all marketing traffic is created equal. Depending on where your traffic is coming from it may have a varying level of qualification.
Qualified Marketing Traffic is anyone that would be considered qualified to buy your product or service. For example, if you’re selling grass seed, someone who is googling where to buy grass seed would be more qualified than someone that found your site googling what kind of grass is used at a golf course.
Qualified Marketing & Sales Leads
The next step in the sales funnel is generating qualified leads. Once we have found what qualified marketing traffic looks like it is time to qualify them a step further and turn them into a lead that can be turned over to sales. The more qualified the marketing traffic the easier it is to turn them into a lead. Depending on what your product or service offers, generating leads may be a varying degree of importance. If you have a longer sales cycle with more touch points it may be more important to create a lead and establish a relationship than a company with a shorter sales cycle that is a quick and easy purchase.
Lead-to-Customer Rate
The last of the marketing scores that we have is the lead-to-customer rate. Simply, this is the rate at which you turn leads into customers. This marketing score is touched by both sales and marketing teams. If marketing is turning over low quality leads the lead-to-customer rate will likely be low. If sales is not speaking to the same message that the marketing team is using this could also lead to a low lead-to-customer rate. The good news, while many aspects have an impact on the LTC it is easy to make small tweaks to increase the rate.

founders
Metrics and data
Current Ratio and Liquidity Ratio
As we’ve discussed before calculating your quick ratio is an easy formula to understand how efficiently your company can grow. The higher the quick ratio the more efficient a company can grow. An example quick ratio formula can be found below:
Quick Ratio Formula = (New MRR + Expansion MRR) / (Contraction MRR + Churned MRR)
In addition to the quick formula, we see many startups track two other financial ratios: current ratio and liquidity ratio. Tracking different financial ratios can be an integral part of a companies’ success as they offer a quick and easily digestible way to understand where your company stands. Where a quick ratio observes your short term financials, the current ratio and liquidity ratio observe all of your assets and long term obligations.
Liquidity Ratio
Liquidity ratio or liquidity ratios are often seen in a similar sense as a quick ratio and can be used as an umbrella term. Both quick ratios and current ratios are a different form of liquidity ratios. According to Investopedia, “Liquidity ratios are an important class of financial metrics used to determine a debtor’s ability to pay off current debt obligations without raising external capital. Liquidity ratios measure a company’s ability to pay debt obligations and its margin of safety through the calculation of metrics including the current ratio, quick ratio, and operating cash flow ratio.”
Related Resource: From IPOs to M&A: Navigating the Different Types of Liquidity Events
Liquidity ratios are important to startups and their investors because it helps determine if a startup can meet their current debt obligations.
Current Ratio
As mentioned above, a current ratio is a form of a liquidity ratio. A current ratio is a longer term look at a companies’ debts and assets. The current ratio formula is very simple and can be found below:
Current Ratio Formula = Current Assets / Current Liabilities
While different companies may interpret what counts as an asset differently, a current ratio of 1 is generally accepted as a good current ratio value. Whereas a quick ratio often observes just your recent revenue, a current ratio takes a holistic view at all of your assets and liabilities which causes a bit more variance from company to company.
All in all, tracking your liquidity ratios (current ratio and quick ratio) can offer both startup leaders and investors a high level view of the companies ability to grow and cover their debt obligations.

founders
Metrics and data
Quick Ratio Formula
The SaaS Quick Ratio is a simple formula used to measure the efficiency of your SaaS company’s growth. A quick ratio gives a company a reliable source to predict how they can grow revenue with churn in mind. In short, the quick ratio formula is new MRR by lost MRR over a period of time. The higher your quick ratio the stronger the growth. The quick ratio formula can be found below:
Quick Ratio Formula = (New MRR + Expansion MRR) / (Contraction MRR + Churned MRR)
A low churn rate is often the most efficient way to grow your SaaS business. While new MRR is vital to a company’s success as well, a high churn rate will make it virtually impossible to have a sustainable growth rate. As Tomasz Tunguz puts it, “If the churn number is unsustainably high, we know from previous churn analyses that high churn implies lower growth rates and dramatically less efficient growth.”
While a high MRR growth rate can mask a high churn rate, the best-in-class companies always have a low growth rate, creating a much higher quick ratio.
Quick Ratio Formula in Visible
Creating a quick ratio formula in Visible is incredibly easy with our formula builder. First, you’ll want to make sure you have your recurring revenue metrics in Visible. We would suggest using user provided metrics or using Google Sheets, Salesforce, HubSpot or ChartMogul to automatically get your recurring revenue metrics in Visible.
Once your metrics are in Visible, you’ll want to start building your quick ratio formula. To start, add any new and expansion MRR metrics in the top line. For our quick ratio formula we only mention MRR and Expansion MRR but this could include reactivated, multiple product, etc. On the bottom row, you’ll want to add any “loss” MRR metrics, like contraction and churned MRR.
After the quick ratio formula is setup, it will automatically be calculated as any new data comes in from your integrations. Next, you’ll want to visualize, distribute, and act on your quick ratio. We suggest sharing your quick ratio with managers and executives on your team so everyone has an easy way to understand the growth of your company at a quick glance. Generally, we do not see companies share their quick ratio with their investors as if you have a down month or period it may display poorly and generate unnecessary concerns.
Tracking your quick ratio is a great way for SaaS companies to get a quick idea of how efficiently they are growing. The easiest way to strengthen your SaaS quick ratio is by shrinking your monthly churn rate. Learn more about your quick ratio here.

founders
Reporting
Do Your Investors Need to Match Your Values?
A post by Brock Benefiel. Brock is a Digital Marketing Consultant, Tech Writer, and Author of the upcoming book Flyover Startups.
Recent high-profile tech controversies have put ethics under the microscope. What role do investors play in a company’s values and how do you fill your boardroom with people on your side?
As a founder, you own the values of your business. You may not own all the shares of the company but the ethics and guidelines that govern your startup will always be your responsibility. You’ve got to protect what you’ve created so it’s necessary to do what you can to assert your control.
This can cause some real headaches if you’re forced to grapple ethical dilemmas with difficult investors. Founders may find themselves with financial backers that are eager to buy-in to a company for its products or services but later seem easy to dismiss your values. That’s a problem.
A founder serves as the ultimate arbiter between the needs of the customers, employees, executive team and the board. The moral framework they construct for guiding their business is often a valuable structure for producing the best possible company to serve everyone’s needs. On the hand, if they are tempted to make unreasonable short-term ethical concessions for a quick surge that sacrifice a long-term vision for growth, everyone is vulnerable to lose in the end.
There is real pressure on founders to be unethical
“Startups are desperate,” Sean Ellis, CEO of collaboration software startup GrowthHackers, told Fortune. “[Mature] companies aren’t going to die if they don’t figure out how to accelerate growth. Most startups will die, and when you’re desperate, you’ll do stupid things.”
There’s no shortage of news (see Theranos, Zenefits, Hampton Creek) of young companies fudging numbers, falsifying product details and generally doing stupid things. Reputations have been wrecked, businesses cratered and the opportunity to accomplish great change have been squandered by these shortsighted snafus.
But any venture requires even honest tech founders to be irrationally ambitious. Getting investors to dole out money now requires convincing them to buy into a future founders can never be sure will ever exist. Then those checks cash and the pressure to show growth quickly and turn that vision into something tangible soon intensifies. But real, sustainable growth is hard and cutting corners can be easy and attractive – especially when the stakes are high.
If you’re a founder that lacks a rigid moral framework for how you conduct business, you’re likely to choose the initial path of least resistance that gets your startup moving quickly. It’s also the course that can later lead you to hitting the wall and going down in flames.
Venture capital dollars don’t optimize for ethics either
VCs face pressure too. They need at least one massive hit out of their profile and have less time for your business and if you’re unlikely to earn it for them. Founders often expect their investors to also serve as mentors. But if your backers are picking up a pen, it’s to write a check not draft your company’s value statement. This quote from Fred Destin nails the limits of venture capital as a moral authority for your startup:
“Venture capital as a funding product is not immoral as much as it is amoral — it rushes in to leverage any opportunity that arises,” Destin wrote recently in Medium. “The individual themselves are mostly (in my experience) of high integrity and have a clear moral compass, but I don’t think many venture partnerships stop to think : “why are we funding this team and can we embrace the mission of this company.”
Let’s face it: the focus of VCs is fetching a 10x return on their investment. Anything else is a bonus for founders.
Set expectations early
But investors should be asking the “why” questions of your business. It’s remarkably short-sighted to sign a term-sheet and shell funds into a company without a clear understanding of what the company values. You can’t control what they choose to ignore. But you do command their attention in pitch meetings and you can emphasize from the jump how your ethics will guide your business. “You need to be upfront about your values,” Brad Burnham of Union Square Ventures said about founders. “You need to implement your values in your system.”
State it explicitly and explain to investors exactly what they are signing on to beyond the term sheet. Then, if problems arise later, you’ve already set the precedent and make the investors choose to be the problem. The burden will be on them to explain to you and the rest of the board why they’ve done it.
You offer a lot upfront – so ask a lot upfront
Pitching investors is a trust exercise all of its own. You’re almost always sharing proprietary information in an investment deck and almost never securing a NDA to prevent potential VC vultures from flying away with your secrets. If you’re willing to easily hand over precious data points and secret product information, you’ve earned the right to demand investors take your code of ethics seriously.
Investors have expectations of you too
Younger CEOs and first-time founders are especially vulnerable to an extra bit of skittishness to appear disruptive or cause unnecessary board drama. You’re entering a boardroom with investors that have likely worked with multiple founders and you might even outnumbered by VCs in the room. Address concerns that may not immediately impact growth in front of a group focused on earning a return can be awkward.
But it’s good and fair to establish early that you have expectations of your investors, especially when they’ll certainly have expectations of you.
Ask investors for their code of ethics
Same as founders, good VCs consider the culture they want to create within their firm and consider how it guides their decision to invest. Some have even argued for a kind of Hippocratic Oath for VCs to take. An investor who hasn’t already spent time weighing moral decisions and etching out an ethical framework for acceptable and unacceptable practices will be surprised when challenged by founders down the road. Same as founders, it’ll be hard to expect a move toward the moral decision over the quick growth compromise.
Ask your investors upfront for their guidelines. In absence of something written, ask them direct questions about why they pick the startups they do and what they value. They might not be prepared to deliver long, well-considered answers. But even that can reveal a lot.
So you’ve vetted investors well and delivered your point-of-view upfront, but yet problems still arise. What do you do?
Keep the board behind you
VCs are human too and when the pressure is on, can be vulnerable to advocate for unethical shortcuts. You’ll have to address it with the individual causing the problem immediately – part of good investor communication is telling VCs when they are wrong. If you reach an impasse with the troublesome investor, you’ve got a problem that needs to be solved with the entire board involved. If you feel your company is about to behave unethically, it’s time to rally the other investors (and the votes) behind you and pressure the problematic VC to back down. Do it out in the open in board meetings or do it behind closed doors. Honestly, it doesn’t matter if you’re airing the issues out in front of everyone or pressing VCs for loyalty pledges in one-on-ones. Investors are there to have your back and if they don’t back you on these conflicts, they are skirting their duty.
Implicit pressure can be unethical
An investor might act unethically by asking you to engage in a task or behavior that you deem unethical. But your board can also be guilty of implicit abuse of your code of conduct. You can’t acquire new customers, boost revenue growth or makeover your product offering at the expense of your company guidelines. You don’t want to deploy shady tactics to show artificial sales spikes or to fudge timelines of when enterprise features will be implemented just to win now.
However, if you don’t have a group of investors that respects the limitations of your current growth or brings sound solutions to the table that empower you to step beyond your boundaries, you have a group of people who unnecessarily pressuring the person in charge. That might not be as sinister as suggesting immoral actions, but it can lead a founder down the wrong path all the same. You don’t want these people as your advisors.
So, to return to the question asked up top, do you need investors to match your values? Yes – at least as it relates to the core tenants of your business. It’s not that complicated. Keep it clear early what you value and why it matters. And if it gets complicated, keep it simple with your current investors (at least the ones that will get it) to ensure everyone stays on the same page.

founders
Reporting
Quickbooks Update Template
QuickBooks Report Template
In the words of Tomasz Tunguz, Partner at Redpoint Ventures, “Financial statements are the Rosetta Stone for a business. They are the most succinct way of communicating how a business operates to management teams and boards, who weigh the trade-offs of different investments”. Distributing your financials to your team, investors, and board is vital to staying on top of your operations and uncovers insights for bringing a new product or service to market.
Using our Quickbooks data source, we put together an Update template that will allow you to easily visualize and distribute your key financial and operational data. Currently, our Quickbooks integration allows you to pull in the following metrics:
Cash
Customers
Employees
Expenses
Months Runway
Net Change in Cash
Net Income
Payables
Receivables
Revenue
Check Out the Template Here >>>
When sending a financial and operational Update it is important to make sure the information is understandable, relevant, reliable, and comparable. Many team members, investors, etc. are likely not concerned about granular data points but rather that they are moving in the right direction and are efficient as possible. Instead of overwhelming stakeholders with spreadsheets and complicated metrics, we’ve often found that it is most useful to send over a few charts with a quick narrative around what is working/not working/etc. For those looking to take it to the next level, it can be useful to include benchmarks and trends in the industry to show how certain metrics and financials are comparing to the industry as whole.
The template is broken down into 3 major components; Operational Overview, Expense Overview, and Other Notes. Keep in mind the financials you are tracking and sharing may change depending on the stage of your company; revenue is obviously not as important for a pre-revenue, early stage company. For our example, this includes revenue, cash position, and a high-level look at company expenses.
founders
Reporting
A Race to One Trillion: Microsoft’s 2017 Investor Letter
The Race to a Trillion Dollar Market Cap
Between the unofficial race to the first one trillion dollar company and the recent acquisition of GitHub we decided it would be an interesting time to look at Microsoft’s most recent shareholder letter. Recently passing Google’s market cap for the first time in 3 years their acquisitions and focus on “the cloud” (doesn’t hurt to purchase the company behind the largest repository of open source software) have proved to be a large factor in their push to $1T.
All of the charts, images, quotes, and emphasis below were added by us. Note: there may be removed sections of portions of the letter below. You can find the original 2017 Microsoft Shareholder Letter here.
PROGRESS AND OUR RESULTS
We delivered $90.0 billion in revenue and $22.3 billion in operating income this past fiscal year. Adjusting for Windows 10 revenue deferrals and restructuring expenses, revenue was $96.7 billion with $29.3 billion in operating income.
According to Morgan Stanley analyst, Microsoft will need to grow their revenue by 46% to $136B and net income to $46B to reach the trillion dollar threshold by 2020.
We continued to invest in innovation and expand our market opportunities, while maintaining our commitment to shareholder return, which included total cash return of $22.3 billion this year.
Our commercial cloud annualized revenue run rate ended the year exceeding $18.9 billion, up more than 56 percent year-over-year. Our cloud growth puts us squarely on track to reach the goal we set a little over two years ago of $20 billion in commercial cloud annualized revenue run rate in fiscal 2018.
“With Public Cloud adoption expected to grow from 21% of workloads today to 44% in the next three years, Microsoft looks poised to maintain a dominant position in a public cloud market we expect to more than double in size to (more than) $250 billion dollars.” – Morgan Stanley Analyst
Microsoft is doubling down on their cloud efforts and are expecting for strong growth with corporate usage for Office 365 and Azure.
The strength of our results across our reporting segments reflects our accelerating innovation as well as increased customer usage and engagement across our businesses
More than 100 million people use Office 365 commercial.
More than 27 million consumers use Office 365 Home & Personal across devices.
More than 53 million members are active on Xbox Live.
More than 500 million LinkedIn members use the LinkedIn network.
Windows 10 is active on more than 500 million devices around the world.
Dynamics 365 customers grew more than 40 percent year-over-year.
Azure compute usage more than doubled year-over-year.
As of June 14, 2018 the market cap for each company is…
Microsoft – $783B
Apple – $946B
Amazon – $832
Google – $806B
LOOKING FORWARD: OUR EXPANSIVE OPPORTUNITY
A new technology paradigm
As you can begin to see in the examples above, a new technology paradigm is emerging, one with an intelligent cloud and an intelligent edge. Microsoft will lead this new era. There are three characteristics that define this shift. The first is that the experience layer is becoming multidevice and multisense, where a person’s experience with technology will span a multitude of devices and become increasingly more natural and multisensory with voice, ink, gestures and gaze interactions. Second, artificial intelligence (AI) will be pervasive across devices, apps and infrastructure to drive insights and act on your behalf. Third, computing will be more distributed than ever before with compute power at the edge, whether it’s the connected car, the connected factory floor or any connected device. As developers write new applications for this paradigm, they need new mechanisms to manage the complexity of distributed, event-driven computing.
Microsoft made a big splash with their recent $7.5B acquisition of GitHub. The acquisition stays in line with Satya Nadella’s focus on the cloud and open source projects. GitHub has already had a large presence in enterprise sales with GitHub enterprise and will be able to tap into Microsoft’s massive enterprise customer base. With the continued growth of public cloud usage Microsoft is looking to grow their strong position in the space.
With this new paradigm comes new opportunity. Every customer is looking for both innovative technology to drive new growth and a strategic partner that can help them build their own digital capability. Customers are looking to change how they use digital technology and to reimagine how they empower their employees, engage customers, optimize their operations, and change the very core of their products and services. They are building their own digital systems of intelligence to drive growth. Microsoft is uniquely positioned to capitalize on this opportunity with the combination of our technology, partner ecosystem and culture of growth mindset.
As we look ahead to fiscal 2018 and beyond, we will focus on bringing our technology and products together into experiences and solutions that deliver new value for our customers. Going forward, we will focus our innovation and investments in areas where we see the greatest opportunity for growth.
The modern workplace
The workplace itself is transforming — from changing employee expectations, a widening skills gap, more diverse and globally distributed teams, to an increasingly complex threat environment. The productivity experiences and tools we deliver will unlock the creator in all of us and enable seamless teamwork not just in the workplace, but also at school and at home across all the devices people use — from the phone to the laptop to mixed-reality headsets to the whiteboard. The Microsoft Graph, which provides the underlying data model of the user’s experience, and the LinkedIn network, will make it possible for every professional in any business or functional role to be much more productive in getting things done.
Enter Office 365, Windows 10, and LinkedIn. Office 365 currently has 100 million users and is expected to double to 200 million by 2020 on top of LinkedIns already 500m users.
Applications and infrastructure
Cloud computing is foundational to enabling digital transformation for any organization. Beyond being a trusted, global, hyper-scale cloud, what makes Azure unique is our hybrid consistency, developer productivity and SaaS application integration. Our hybrid infrastructure consistency spans identity, data, compute, management and security, helping to support the real-world needs and evolving regulatory requirements of commercial customers and enterprise-focused SaaS ISVs. Azure Stack is an extension of Azure that enables developers to build and deploy applications the same way whether they run on the intelligent cloud or the intelligent edge. With Visual Studio and Azure Services, we provide the toolchain and application platform for modern DevOps that helps organizations with their agility and productivity — and enable them to use the best of the Windows ecosystem and the best of the Linux ecosystem together. Azure enables SaaS ISV developers to reach 100 million plus enterprise users through the integration of Azure Active Directory and Office 365, and by embedding Power BI, Power Apps and Flow as part of their applications, enables customers to have consistent identity, developer extensibility and security across their application portfolio spanning their own custom applications and SaaS applications.
Microsoft has doubled down on their cloud investment and are going after Amazon and Google’s cloud services as the market continues to grow.
While AWS still has a commanding percentage of the enterprise cloud market Azure has been rapidly chipping away at Amazon’s lead. Azure went from 34% to 45% of the market while AWS still grew from 57% to 64%. The data above comes from a survey by TechRepublic of 1000 technical professionals.
Gaming
The $100 billion plus gaming industry is experiencing massive growth and transformation, and we have an expansive opportunity as we think about gaming end-to-end — from the way games are created and distributed to how they are played and viewed. We will build on our strong foundation of connected gaming assets across PC, console, mobile and work to grow and engage the 53 million strong Xbox Live member network more deeply and frequently — from great game experiences to streaming to social to mixed reality. We will be the company for gamers to play the games they want, with the people they want, on the devices they want. I’m excited about our opportunity to accelerate our growth opportunity, innovate boldly and earn new fans.
Microsoft has been on an acquisition spree in the gaming market. On June 10, Microsoft announced the acquisition of 4 game studios as they continue to innovate and grow their gaming business. Microsoft’s continued investment in Xbox, AI, and live streaming video games have the opportunity to be a large part of their Azure Cloud business.

founders
Hiring & Talent
Metrics and data
An Update Template for Sharing Your HubSpot Funnel Metrics
What campaigns are working? What content is performing best? Where can we improve inefficiencies? Where should we double down? Continuing to review, analyze, and “duct-tape” your funnel is key to executing an agile marketing playbook.
“Data doesn’t do you any good unless you act on it. Each of these metrics clearly tells you how you’re doing. Right away, you’ll know where you need to spend your time.” – Andrew Chen, a16z
General Funnel Metrics
Automatically bring in general funnel metrics using our HubSpot integration. Bring in basic lead counts or use filters to bring in granular funnel metrics to dig into where you can improve the most. You can check out examples for bringing in different pipeline stages below:
Different Lead Stages; subscribers, MQLs, SQLs, PQLs, etc. – Start with “Contacts” as your HubSpot Object. Anchor the date to any field you or HubSpot are automatically tracking; create date, became an XYZ date, etc. From here, you can filter your different contacts however you’d like. For this example, we our simply using our “Lifecycle Stage” but can easily break that down by different sources, personas, sales reps, etc.
Note: Use the value field to tie a monetary value to your metrics. For example, using “Deal Amount” to bring in the value of all of the contacts in a certain stage. From here, you can use formulas to calculate the weighted value of different pipeline stages.
New Customers – Start by connecting the object where you are tracking new customers and their value; likely companies or deals. Just as you would for lead stages, you’ll want to anchor the object to the field that denotes a new customer; lifecycle stage, etc. Use the value field to bring in a simple count or the total dollar amount for won deals. Easily take a look at the row level data to see where customers are coming from, renewal dates, and more.
Top of Funnel: Lead Source Breakdown
Marketing attribution is tough. Staying on top of your lead sources and continuing to tweak and improve inefficiencies is a quick way to keep your growth metrics moving in the right direction. Keep tabs on where your leads are coming from by filtering different leads by their lead source.Use “Filters” when connecting HubSpot to Visible to break down new leads by different sources, campaigns, and events. Drill down using row level data to see what specific leads are coming from what sources.
You can check out an Update example for sharing your funnel metrics and lead sources here.
founders
Reporting
“Our Coffee & Our People”: The Starbucks 1992 Investor Letter
Howard Schultz recently announced that he will be stepping down as executive chairman of Starbucks; exactly 26 years after their initial public offering. In 26 years as a public company, Howard helped transform Starbucks from a small coffee chain into a global brand with over 27,000 locations.
In our newest investor letter, we can take a look at the 1992 Starbucks Shareholder Letter; their first as a publicly traded company. With no mentions of mobile ordering, international expansion, or Unicorn Frappuccinos it is remarkable to see the growth that Starbucks experienced with Howard Schultz at the helm. Expanding from 154 to 27,000+ locations two things have stayed true throughout; Starbuck’s commitment to their people and their coffee.
All of the charts, images, quotes, and emphasis below were added by us. You can find the original 1992 Starbucks Shareholder Letter here.
The 1992 Starbucks Shareholder Letter
TO OUR SHAREHOLDERS:
Every successful business has its competitive advantage. At Starbucks we have two: Our coffee and our people. Since our inception in 1971, Starbucks has been based on an unrelenting (some would say fanatical) devotion to providing its customers with the best possible cup of coffee.
In Howard’s last shareholder letter (2016) this still rings true. Starbucks has continued to double down on enhancing the lives of their “partners” and the communities where they live and work.
One indicator of this passionate commitment is the question we ask ourselves whenever we assess our efforts: are they as good as the coffee? Our retail stores are intended to be environments worthy of housing the finest coffees which nature and skilled human labor can provide. Dedication to quality, in the cup, is what Starbucks is all about.
At the time of their IPO Starbucks was doing ~100,000 transactions at their retail stores a week. As of 2016? 85M+ transactions a week across their retail stores. In addition to their focus on people, Starbucks has scaled their transactions while staying true to their focus on quality coffee. Below is an excerpt from Howard’s letter to partners announcing his departure:
“Sourcing and roasting the highest quality arabica coffee will always be our heritage. Never stop reaffirming Starbucks leadership position in all things coffee. I can think of no better expression of this than our Reserve stores.”
A look inside the experimental Starbucks Reserve in Chicago.
Many of the specifics that make our company seem unique to others are, to our way of thinking, simply natural, even inevitable, consequences of this core attitude and aspiration. Quality coffees are grown, roasted, brewed, by quality people, and the welfare of the people, the planet and product are inextricably linked. Our “employees” are called partners, and this is literally true, since every individual is offered stock options.
We seek to seamlessly interweave variables that ensure quality for the customer with literal ownership in the company. We want to be the employer of choice in each market in which we do business. In order to achieve this goal we pay fairly, provide benefits to all whether part-time or full-time, and encourage individuality and open communication. Our environmental commitment begins with recycling and conserving wherever possible.
We donate coffee locally in every market, providing homeless shelters and hospices better coffee for free than many of our competitors offer at full price. We are also entering our second year as the West Coast’s largest corporate donor to CARE, the international aid and development organization. Starbucks, together with its customers, funds CARE programs in the coffee producing countries of Indonesia, Kenya and Guatemala, with an emphasis on disease prevention and increased literacy for children. This year has been an exceptionally rewarding one.
We achieved sales of $93,078,000 which were up 61.5% from 1991. We opened 53 new stores, including ones in our newest markets of San Diego, San Francisco and Denver.
To no surprise, Starbucks has not been able to sustain their growth rate after raising $25M+ from their IPO but have continued to grow store locations at a steady rate. In 2017 more brick-and-mortar stores closed since the start of the “Great Recession” (2007), yet Starbucks added 2,250 net new store locations over the course of the year. The commitment to their people, coffee, and culture has continued to resonate with customers around the world.
Also, we earned $4,104,000 after tax which represented a 70.4% increases versus a year ago. Lastly, Starbucks’ entrance into the world of publicly-owned companies this June was profoundly significant, both within the company and for the specialty coffee industry as a whole. It is an affirmation of our leadership position, but it is first and foremost a powerful demonstration of what can result from the joining together of great people and great coffee.
Howard Schultz
chairman, president, and chief executive officer

founders
Metrics and data
Use Sheetgo To Consolidate Your Google Sheets Reporting
Hate them or love them, spreadsheets are here to stay. Everyone has been a part of the confusion that comes with tracking and sharing your spreadsheets. A few metrics here, a few metrics there, it can become a days work to find and surface the right sheets. Thanks to our friends at Sheetgo you can easily centralize and consolidate all of your online spreadsheet data across multiple Google Sheets and CSV files.
Centralize Your Data
No need to chase managers and colleagues for their spreadsheets and data on a regular basis. Using Sheetgo you can easily connect multiple Google Sheets to feed into a master sheet to have your key data at your fingertips. SheetGo is a powerful tool to build, maintain, and scale an internal data distribution system.
When connecting multiple sheets you likely won’t need all of the data points in each. SheetGo can be as powerful or simple as you would like. Use their filters to determine what data you will be bringing in from each sheet or use personal queries to customize the process to your needs.
Outside of centralizing your team’s data help your clients, board, and investors stay on top of key data with consolidated sheets. Running ad campaigns on multiple platforms for a client? Easily take the data exports and centralize all of their vital data into one sheet.
Visualize & Distribute
Once you have your Sheetgo connections in place connect a single sheet to Visible to visualize and distribute your data. As you continue to update the individual sheets fueling your “master sheet” your charts, dashboards, and Updates will automatically refresh in Visible as well. Using a combination of Visible & Sheetgo it has never been easier to stay on top of your spreadsheets and avoid the frustration that comes with hunting down your data.
Ready to simplify your teams spreadsheets and data? Check out Sheetgo and let us know what you think.
founders
Reporting
Netflix IPO: A Lesson in Investor Relations from Reed Hastings
Just a few days away from the 16th anniversary of the Netflix IPO we decided to take a look at the initial investor letter and market sentiment from May 2002. Merely a DVD rental subscription at the time Reed Hastings briefly mentions online streaming and fails to mention creating original content. At the time a “niche business“, Netflix has transformed into a media giant and one of the more intriguing technology companies of our era.
Fast forward to 2018 and the only way I know how to watch a DVD is in a friend’s 2003 Honda Odyssey. Or better yet, I can just pull up the Netflix app on my phone and start streaming Stranger Things, Narcos, or one of their other original productions.
All of the charts, images, quotes, and emphasis below were added by us. You can find the original 2002 letter from Netflix CEO, Reed Hastings, using this link.
The 2002 Netflix IPO Letter to Investors
I’m pleased to report to you that 2002 was a truly remarkable year for Netflix. In this, our first year as a public company, we met or exceeded all of the financial and operational goals we had set for ourselves 12 months earlier. During a time of continuing uncertainty in the technology and financial markets, we were one of only eight technology companies to successfully complete an initial public offering in 2002. And in each of our three subsequent reporting periods as a public company, we outperformed investor expectations for key financial metrics, including revenues, expenses, EBITDA, and free cash flow.
In this climate, the strength of our business model has been resoundingly validated by consumers who, in ever increasing numbers, have found significant enjoyment and value in our online movie rental service. In this letter, I will explain to you how this model works, why it is working so well, and why we believe it will ultimately change the way people experience and enjoy watching movies at home.
First, I’d like to share with you a few highlights from our past year.
THE PERFORMANCE OF THE YEAR.
During 2002, we experienced the kind of rapid growth that many technology companies promised just a few short years ago but few delivered.
In 2002, we doubled our revenue to $152.8 million, from $75.9 million in 2001. We ended the year with approximately 857,000 total subscribers (more than 1 million as of this writing), up 88 percent over the previous year. With positive free cash flow of $15.8 million for 2002 and $104 million of cash and short term investments, we have, and intend to maintain, an extremely strong balance sheet.
Clearly, we are pleased with the results of the past 12 months. In addition to our strong financial performance, our accomplishments also included surpassing, in our first major metropolitan target market of San Francisco, our nationwide goal of 5 percent household penetration.
Since 2002, Netflix has thwarted their expectations of 5% household penetration. As of January 2018, Netflix has made its way into 50%+ of U.S. households with broadband access.
We remain opportunistic in looking for ways to improve our service and our operations. In 2002, we invested in 12 new distribution centers around the U.S., increasing the number of our subscribers who receive their DVDs with next-day service through the U.S. mail. Our marketing initiatives to acquire new subscribers through various channels including banner advertising, direct merchandising, and word-of-mouth remain highly successful. We will continue to evaluate the cost-effectiveness of new channels such as broadcast television as the number of DVD households continues to grow.
Remarkably, Netflix still operates 17 distribution centers. A low from their 50+ they had in 2016. Netflix has continued to own marketing. Transitioning from banner ads and direct merchandising to impressive product (e.g. original content, personalized content, etc.), multi-channel, and email marketing.
BUSINESS BASICS.
Investors are right to ask why a company, regardless of how well it may be doing at present, believes its success will endure. At Netflix, we are encouraged by a number of market trends that indicate strong demand for our service in both the immediate and long-term future.
For starters, consumers are becoming increasingly comfortable with the Internet. The widespread adoption of broadband technologies means a smoother web experience for more people across the U.S. In particular, people are coming to appreciate the more personalized recommendations that are enabled by software (compared to, for example, recommendations from video store clerks who may know nothing about their customers’ movie tastes) as well as the ease and security with which purchases may now be made online.
Netflix has stayed true to this idea and continues to dominate competitors in algorithmic based content curation (more below).
Second, as hardware improves and costs come down, the growth of DVD as the medium of choice for at-home movie entertainment is accelerating. We expect that household penetration of DVD, already the fastest-growing consumer electronics product in history, will climb from its approximately 40 million TV households currently to over 100 million in the next three years.
As DVD ownership has become more mainstream, so has our subscriber base. In 1998 the demographic profile of our initial target subscriber was a classic early adopter: predominantly affluent, technologically-savvy, and male. Today, women make up more than half of our subscribers, while the household income of members joining today is roughly half that of subscribers who joined two years ago.
MERCHANDISING MAGIC.
The result of these trends is a market that we currently dominate with a highly visible brand presence. It is also a market that we believe will continue to mature, along with our Company. To ensure that we take advantage of this momentum, we are continually developing our understanding of how people browse and select movies.
The key to our phenomenal consumer acceptance and business success is the sophisticated software that powers our website. Here, our subscribers are able to browse through 14,500 film titles—virtually every movie available on DVD, including both the latest and most popular TV series as well as hard-to-find documentaries—and place the ones they want to receive on a rental list that they continually replenish with new choices.
In the past year we have significantly improved our ability to merchandise our titles to match the tastes of our subscribers. Beyond the richness of our inventory and the robustness of our distribution software lies what we believe is the true strength of the Netflix model: a proprietary system for personalizing movie recommendations for each subscriber via a remarkably powerful and innovative rating system. Instead of using someone else’s tastes to guide a subscriber’s choices, Netflix builds a profile of each person’s movie likes and dislikes to truly personalize a DVD recommendation.
Evolution of the Netflix personalization approach
“We want our recommendations to be accurate in that they are relevant to the tastes of our members, but they also need to be diverse so that we can address the spectrum of a member’s interests versus only focusing on one. We want to be able to highlight the depth in the catalog we have in those interests and also the breadth we have across other areas to help our members explore and even find new interests. We want our recommendations to be fresh and responsive to the actions a member takes, such as watching a show, adding to their list, or rating; but we also want some stability so that people are familiar with their homepage and can easily find videos they’ve been recommended in the recent past.” – From a 2015 Netflix Technology Blog Post
The result is more often than not the movie-lover’s discovery of a personal “gem”: a movie that a subscriber has perhaps never even heard of and which may turn out to be a genuine favorite. This kind of match expands the audience for both acclaimed and lesser-known films—award winners that made their debut on DVD through Netflix and have gone on to find broad distribution, as well as smaller, low-profile movies from independent filmmakers and distributors.
Subscribers rented fully 97 percent of the movie titles we carried in the fourth quarter of 2002. To help achieve such remarkably broad inventory utilization, we’ve added new areas on our website, such as the Critic’s Pick page and the Netflix Top 100 page, that make it easier for subscribers to discover interesting content. For customers who know what they want to watch, we’ve made the search function more intuitive, with better ranking of search results and more obvious results listings. And we’ve made it easier for subscribers to answer their questions and resolve problems online, which has reduced our service costs.
LOOKING AHEAD.
Our vision is to change the way people access and view the movies they love. To accomplish that, on a large scale, we have set a long-term goal to acquire 5 million subscribers in the U.S., or 5 percent of U.S. TV households over the next four to seven years. By then, we expect to generate $1 billion in revenue and $100 to $200 million in free cash flow.
In the shorter term, a year from now, I expect to be able to report to you that we ended the year 2003 with 25 operational U.S. distribution hubs, initiated international expansion into Canada, and generated total revenue of more than $235 million.
We are fortunate to have in place an extremely strong management team that has both the experience and the vision to propel the Company forward in what we believe will be a dynamic new market. As we continue to roll out and improve our service, we are optimistic that we have the potential for even greater gains ahead.
The coming year promises to be an exciting one for Netflix, and we hope that you’ll be with us to enjoy the show. On behalf of the management team and dedicated staff at Netflix, I would like to thank you for your continued support over the past year, and I look forward to your continued participation as a member of the Netflix family.
Sincerely,
Reed Hastings – Chief Executive Officer, President, and Co-Founder

founders
Hiring & Talent
Operations
Metrics and data
Operations
Startups: Why Send Management Reports?
Successful companies share a few key traits… so do unsuccessful ones. Investors, executives, team members, potential hires, etc. understand this. Regular management reports show the CEO/CFO/etc. are key in keeping business decisions agile while showing you value what your management team brings to the table.
How Can You Get Started with Successful Management Reports?
It’s a lot easier than you might think. Good management reports don’t have to be long and they don’t have to be time consuming. If you’ve already got metrics, KPIs, etc. in place with your teams it is a matter of extracting the key data and turning it into something easily replicable, actionable, and digestible. Sharing financials, metrics, and dashboards can certainly be useful to managers but suffocating at the same time.
Bringing clarity and simplicity to management reporting is a strong start to avoid “the activity trap” and keep managers, teams, and individuals focused on their original purpose. It is easy for team members to get lost in their day to day and ultimately forget why they joined your company to grow the company and themselves. In working with countless CEOs, CFOs, and managers, we have a few things to keep in mind while building your management reporting and data distribution system:
Replicable – Keep metrics and objectives comparable from report to report. Chances are you’ve got an objective in place so be sure to highlight that in every report to keep focus where it matters most.
Actionable – Be sure that the report leaves room for questions, discussions, and a game plan until your next meeting, report, etc.
Digestible – Make the report light and to the point. Be sure to include only the 2-6 most vital metrics as full dashboards and spreadsheets can become suffocating and distract from your manager’s main objectives.
An Example Management Report
You can check out an example of a Visible Management Report Here.
As always, feel free to sign-up for a free trial here and email support@visible.vc if you’d like the template dropped into your account.
founders
Metrics and data
Product Updates
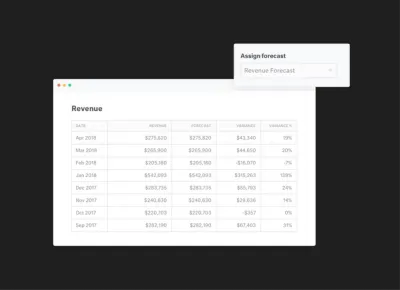
Using Variance Reporting in Visible
Use Variance Reports to Determine How You’re Tracking to Your Projections
How are we doing? Are things going to plan? Are we overspending? Underspending? Where should we double-down? Cutback?
These are all questions that you’ve likely encountered in a management meeting or recent board meeting.
Today we are excited to announce new Variance Report module that will be part of our insights layer. Variance reporting will let our customers quickly assign any of their KPIs to a forecasted or budgeted value and with one-click get back a full Variance Report.
We’ll calculate the following in your Variance Report:
MTD Variance
MTD Variance %
YTD Actual
YTD Variance
YTD Variance %
YTD Actual
prior yr YTD Actual
prior yr YTD Variance
prior yr YTD Variance %
Our budget vs actual and variance reporting will give you instant insights and reporting capabilities for any of your metrics in Visible. Being able to make timely decisions based on your forecasts and budget will help accelerate growth, manage your bottom line and hit goals across your organization. Utilizing the variance report in Visible is great for:
Weekly team updates showing progess towards your Monthly and Annual Goals
Crafting monthly management reports to your leadership teams providing feedback on where you under/over performed
Creating pre-board meeting reports that give a health check on where you are compared to board approved budgets.
We hope you enjoy! Sign in to Visible to get started to or sign up! Feel free to email support@visible.vc with any questions, comments and feedback.
Up & to the right, The Visible Team

founders
Metrics and data
Top Down vs Bottoms Up Projections
Financial projections are essential for any business, even if it’s not yet generating revenue. A variety of specific methods exist for performing this task, but they can generally be classified into top-down and bottom-up approaches. Financial analysts often use both methods as checks upon each other.
Top Down Projections
A top-down method of estimating future financial performance uses general parameters to develop specific projection numbers. You’ll often use a top-down approach to determine the market share that your new business can expect to receive. You might start with the market value of your product, narrowing it down to a particular location as much as possible. You would then assume that your business will receive a specific portion of that market and use that estimate to generate a sales forecast.
A top-down approach is comparatively easy since the only parameters it really requires is the total market value for your area and the market share you expect to receive. This method is most useful for checking the reasonableness of the projections resulting from a bottom-up approach. However, top down projections aren’t recommended for preparing detailed forecasts.
Example
Assume for this example you plan to open a business in an area where the total annual sale value of your product is $2 billion. You believe that your business might get 0.01 percent of that market, resulting in annual sales of $200,000. Note that your financial projection is entirely dependent upon the accuracy of your estimate on the product’s market value and your market share. Furthermore, the top-down approach doesn’t you to ask “what if” type questions.
Bottoms Up Projections
The bottom-up approach uses specific parameters to develop a general forecast of a business’s performance. This method might start the number people you expect to pass by your business each day, also known as footfall. You would then estimate the percentage of footfall that will enter your store and make a purchase. The next step is to estimate the average value of each purchase to project your annual sales. Bottoms up projections are based on a set of individual assumptions, allowing you to determine the impact of changing a particular parameter with relative ease.
You may use a bottom-up approach to select a location for a new business. You can obtain an accurate estimate of the footfall by direct observation. You can also observe similar stores in that area to estimate the percentage of footfall that are likely to enter your store. The prices that your competitors charge will give you a good idea of the price you can expect to charge.
Example
Assume for this example that an average of 10,000 people pass by a particular location each day. About one percent of this traffic in this area enters a store and makes a purchase, and the average total of each sale is about $5. The expected annual sales revenue in this example is therefore 10,000 x 0.01 x 5 x 365 = $182,500. You can then refine this estimate by considering additional factors such as price changes, closing on weekends and seasonal fluctuations.

founders
Hiring & Talent
What Does a Bad Sales Hire Really Cost Your Startup?
How to Avoid a Bad Sales Hire
It’s a dilemma for any company: your growing startup begins to face increasingly aggressive quarterly goals and the pressure is on to scale your sales team to meet the growing needs. Why is growth a challenge? It increases your chances of making the wrong hire.
According to Mindflash, 38 percent of all bad hires come from companies looking to fill a position quickly. Another 21 percent blamed an inability to test or research the employee’s skills well enough while another 11 percent pinned the bad hire on the company’s failure to check out references. Each scenario screams out a company pulling the trigger too quickly to fill a spot. This can be an especially deadly concern when it comes to your sales team.
There’s no doubting that filling sales positions is hard. When surveying companies from 2006 to 2012 on the hardest jobs to fill, the ManpowerGroup consistently named sales as the annual winner for the toughest department.
For every company, it’s a large opportunity cost to miss out on the next great closer and land a dud instead. But for a cash-conscious growing business, a bad sales hire can be especially devastating. Many businesses have considered the costs of a bad hire to equal the amount it takes to recruit, onboard and train a salesperson. But a bad sales hire isn’t simply limited to the hiring costs. Your business will incur more than a fixed set of initial costs.
Chris Young believes you can expect to calculate the total costs by adding up these two categories:
The cost to recruit, onboard, and train a salesperson.
The average sales of your Top 20%, Average, and Bottom 20% salespeople.
You can expect a bad sales hire to cost your business well into a six-figure sum. A 2012 report by the DePaul University Centre for Sales Leadership estimated an $114,957 price tag on the cost to hire, train, and replace a salesperson alone. The same report claimed a 28 percent turnover rate for salespeople.
Then there’s the toll it takes on your team. The amount of administration and management time that will be sucked from your staff when you make the wrong hire can be staggering. Bad sales hires require special attention and additional training when employed. Studies have shown that an average sales manager wastes 13 percent of their time focused on poor performers. Then, when the inevitable need to terminate arrives, administrators will need to spend valuable time following the proper protocols to justify and oversee the employee’s dismissal. Finally, your HR department will spend additional time with exit interviews and you might be on the hook for severance costs.
In their 2006 book Never Hire A Bad Salesperson Again, Dr. Christopher Croner and Richard Abraham also argued a business will face soft costs with any sales hire like losing value from the customers your rep is handling through neglect or poor behavior. Croner and Abraham estimated the cost at 10 percent of a rep’s quota.
Despite whatever short-term needs your business may face, it’s essential to the long-term health of your organization to avoid bad hires at all costs. If that means slowing down headcount and even missing a quarterly goal as a result, it’s likely worth it. Make sure to communicate with your investors when you are facing a lack of qualified candidates. Lean on their expertise and network to better your chances at making good hires if you’re truly in need. Talk honestly about your hesitation to hire if you show up at monthly or quarterly meetings having failed to scale headcount according to plan. Keep your position consistent: you’d rather lose little now than pay a lot more later for a bad sales rep.
Related resource: 9 Signs It’s Time To Hire in a Startup
Unlock Your Investor Relationships. Try Visible for Free for 14 Days.
Start Your Free Trial