

For venture capitalists, timing is everything. The ability to recognize a turning point in a portfolio company’s performance, either positive or negative, can be the difference between a missed opportunity and a game-changing intervention.
At Visible, we’ve seen how metric alerts can transform a VC’s ability to stay ahead. By proactively flagging key performance shifts, you can deliver guidance exactly when it’s needed or celebrate a win in real time.
Recently, we identified a list of high-impact metrics from our proprietary dataset to identify which alerts are set most often and what thresholds matter most to investors. The result: a short list of high-impact metrics and recommended thresholds that VCs can start monitoring today.
A Quick Overview of Metric Alerts in Visible
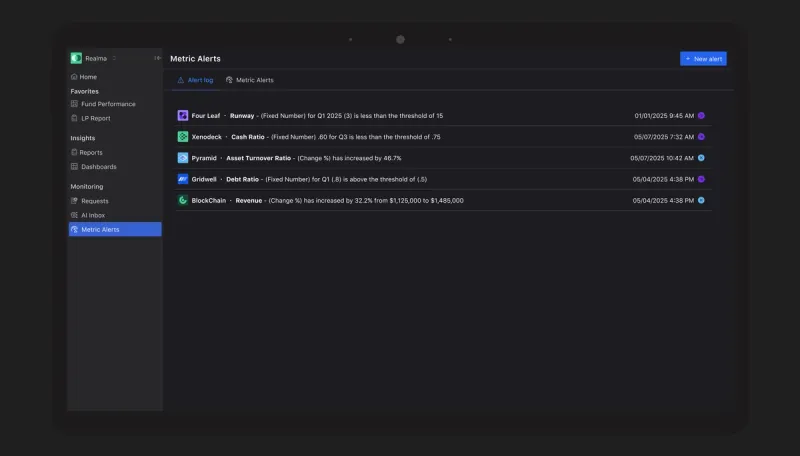
Metric alerts allow you to set specific performance thresholds for any tracked metric and receive notifications when they are met or exceeded. This ensures you’re not just reviewing data after the fact, but acting on it in real time.
With Visible, you can:
- Choose alerts for the metrics you care about most.
- Set custom floor or ceiling thresholds.
- Define how alerts are triggered (percentage shifts, fixed number changes, period-over-period changes, etc.).
- Receive timely notifications when your conditions are met.
Learn more about how to set up metric alerts in Visible →
The Most Commonly Tracked Metrics and Recommended Thresholds
Our analysis surfaced six key metrics that investors track most often. Here’s what they mean and the most common set of related metric alerts..
1. Months of Runway
Definition: The number of months a company can continue operating at its current burn rate before cash reserves are depleted.
Formula: Runway (months) = Cash on Hand / (Average Monthly Operating Expenses – Average Monthly Revenue)
Common Alert Thresholds:
- Critical Alert: < 3 months - Immediate need for capital or drastic cost adjustments.
- Caution Alert: < 6 months - Funding conversations should be underway.
- Observation Alert: < 12 months - Useful for keeping an eye on mid-term capital needs.
2. Cash Ratio
Definition: Liquidity metric showing a company’s ability to pay short-term liabilities using only cash and cash equivalents.
Formula: Cash Ratio = (Cash + Cash Equivalents) / Current Liabilities
Floor Alerts:
- Critical Alert: < 0.5 - Potential inability to cover short-term obligations.
- Caution Alert: < 0.75 Trailing average for 2+ periods - Warning of deteriorating liquidity.
Ceiling Alerts:
- Observation Alert: > 2.0 Trailing average for 2+ periods without major planned expenses which could indicate idle capital.
- Overcapitalization Alert: > 3.0 Without investment plans in next 2 quarters - Displays possible inefficiency in capital deployment.
- Spike Alert: > 50% Change % - Could point to new funding or asset sales.
3. Asset Turnover Ratio
Definition: Measures how efficiently a company uses assets to generate revenue.
Formula: Asset Turnover Ratio = Net Sales (Revenue) / Average Total Assets
Floor Alerts:
- Critical Alert: Below industry-adjusted threshold (default < 0.5).
- Caution Alert: > 20% Previous period change.
Ceiling Alerts:
- Observation Alert: > 2.0 Trailing average for 2+ periods without asset base expansion.
- Spike Alert: Jump > 30% Previous period change - Worth investigating source of sudden efficiency.
4. Debt Ratio
Definition: The proportion of total assets financed by debt to better understand leverage and underlying risk.
Formula: Debt Ratio = Total Liabilities / Total Assets
Floor Alerts:
- Conservative Alert: < 0.1 - Very low leverage with potential underutilization of debt capacity.
- Growth Watch Alert: < 0.2 - Trailing average for 3+ periods which could suggest overly cautious capital structure.
Ceiling Alerts:
- Caution Alert: > 0.6 - Leverage is approaching riskier territory.
- Critical Alert: > 0.8 - High financial risk.
- Leverage Spike Alert: > 15% Previous period change.
5. EBITDA Margin
Definition: Operating profitability as a percentage of revenue, excluding interest, taxes, depreciation, and amortization.
Formula: EBITDA Margin = (EBITDA / Net Sales (Revenue) * 100
Floor Alerts:
- Critical Alert: < 0% - Signaling negative operating profitability.
- Caution Alert: < 10% (unless industry-adjusted).
- Compression Alert: > 5% Previous period change.
Ceiling Alerts:
- Observation Alert: > 40% (unless industry-adjusted).
- Spike Alert: > 10% Previous period change.
- Efficiency Over-Optimization Alert: >10% trailing average for 2+ periods
6. Revenue Growth (QoQ)
Definition: Quarter-over-quarter revenue increase, expressed as a percentage.
Formula: Revenue Growth (QoQ) = ((Revenue current quarter - Revenue previous quarter)/ Revenue previous quarter) * 100
Common Alert Threshold:
- Positive Growth Alert: ≥ 20% Previous period change – Shows strong growth momentum, often worth deeper review or follow-up.
Proactive Insights, Timely Action
By setting smart, data-driven thresholds for these metrics, you can spot risks and opportunities before they’re obvious in quarterly reports. This approach ensures you’re showing up for founders with the right guidance at the right time.
Ready to set up your first metric alerts? Learn how here.


