Your New & Improved Data Section

Ciaran Hanrahan
Experience Improvements Frequencies Metric Settings
Unlock your investor relationships. Try Visible for free for 14 days.
Start your free trial

The Visible team recently pushed changes to the data section to provide more insights, context and usability.

We’ve broken down the data section into a couple of key components.

Experience Improvements

With just a single click you can automatically generate a chart for any metric. You’ll have the option to return to the data section to create additional metrics or you can go to the respective dashboard and continue to edit the chart.
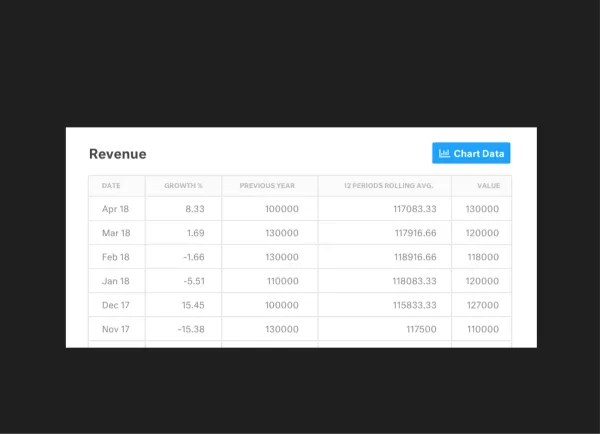
Insights
With just a few clicks, you’ll be able to see the following metrics that we automatically calculate for you:

  • Growth % – the change from the previous year
  • Previous Year – the value for the same metric one year prior
  • Previous Year Change – The % change for the same metric from the previous year
  • Total – The cumulative total for all the values of a given metric
  • 3 Period Rolling Avg. – The rolling average for the previous 3 periods.
  • 6 Period Rolling Avg. – The rolling average for the previous 6 periods.
  • 12 Period Rolling Avg – The rolling average for the previous 12 periods.

Frequencies

We will automatically roll data up to different frequencies. E.g. if you are bringing in daily data, you’ll be able to view it as:

  • Daily
  • Weekly
  • Quarterly
  • Annually

Metric Settings

This is where you can set the type of metric, the default color for your charting needs, description and any other pertinent settings for the metric.

We’ll be updating data connections and the chart builder in the near future to provide an ever more seamless workflow. As always ping hi@visible.vc should you have any questions or feedback.

Up & to the right,

-Ciarán & The Visible Team

You may also enjoy:
Metrics and data
Using Benchmarks as a Diagnostic with Kyle Poyar
On the fifth episode of the Thrive Through Connection Podcast, we welcome Kyle Poyar, the founder of Tremont and Growth Unhinged. Tremont is an early growth equity firm based in Boston. Kyle joins us to break down his career supporting companies at OpenView, how SaaS companies should think about benchmarks, and the future of SaaS investing. About Kyle Before founding Tremont, Kyle was an Operating Partner at OpenView Ventures. During his time there, he launched the SaaS Benchmarks Report, a staple in the SaaS industry. Since then, Kyle has started Growth Unhinged, his newsletter breaking down the playbooks and tactics behind best-in-class startups. Mike, the CEO and Founder of Visible, had an opportunity to sit down and chat with Kyle. You can give the full episode a listen below: Spotify Link Apple Link What You Can Expect to Learn from Kyle How investors and founders can think about leveraging benchmarks Which SaaS metrics and benchmarks are growing in importance Why hiring is the lowest-hanging fruit for VCs to support portfolio companies How he built a content flywheel at Growth Unhinged Stay up to date with the Thrive Through Connection Podcast by subscribing wherever you listen to podcasts. You can find links to your favorite podcast hosts below: YouTube Spotify Apple
Customer Stories
Building Trust and Vulnerability in Business with Max Yoder
Reporting
Navigating Investor Relationships with Brett Brohl
Fundraising
Going From Operator to Funder with Leo Polovets