
Visualizing and analyzing portfolio data is an important part of taking portfolio monitoring seriously at any venture firm.
Visible makes this easy with four different dashboard types:
- Flexible dashboards
- Portfolio metric dashboards
- Fund performance dashboards
- Tear sheets (which have the same functionality as flexible dashboards but are restricted to a one-page format)
Related resource: Unlocking Venture Capital Portfolio Insights with Dashboards
In these latest product updates, Visible makes it easier for VCs to maintain data visualization accuracy and ensure that the qualitative information about portfolio companies is as up-to-date as possible on flexible dashboards.
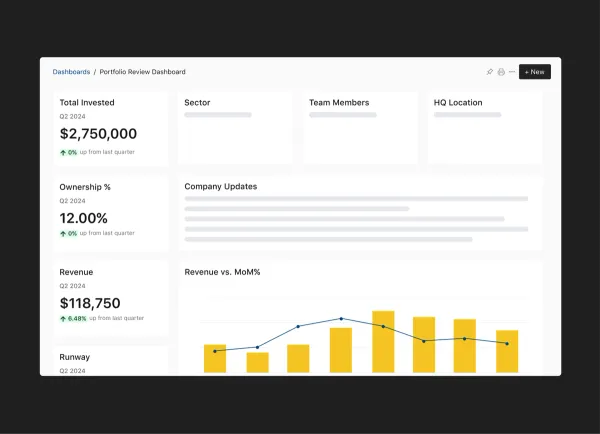
The main reason VCs create flexible dashboards on Visible is to support their internal portfolio review meetings. These meetings help VC firms align on the progress updates across the portfolio and make strategic decisions related to portfolio support and follow-on investments.
Keep reading to understand how recent product updates make it even easier to manage and update data visualizations on Visible's flexible dashboards.
Recent Dashboard Management Product Updates
Setting date ranges at the dashboard level
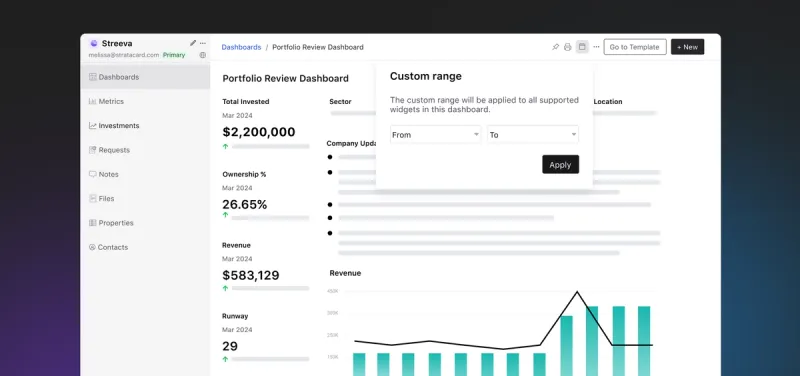
With this product update, investors can filter entire dashboards by a custom date range in addition to setting specific date ranges at the widget level. This streamlines the dashboard creation and maintenance process.
Automatically updated company highlights and lowlights
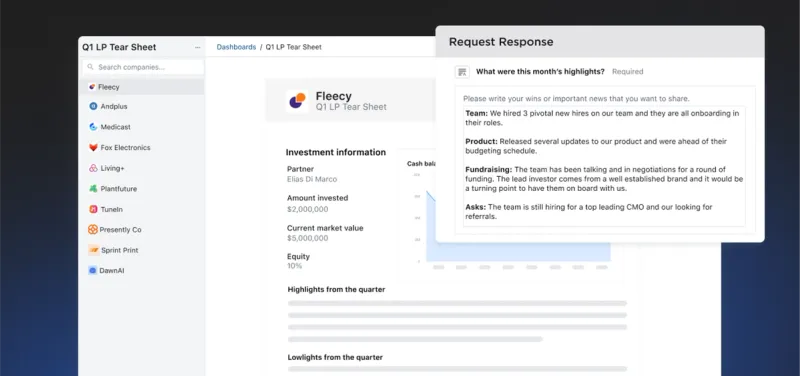
Investors can now request properties in Visible Requests and when companies submit their responses to qualitative questions, the property widgets are automatically updated on dashboards. This saves investors several steps in the process of making qualitative updates from their companies accessible to their wider team.
Editing properties inline on dashboards
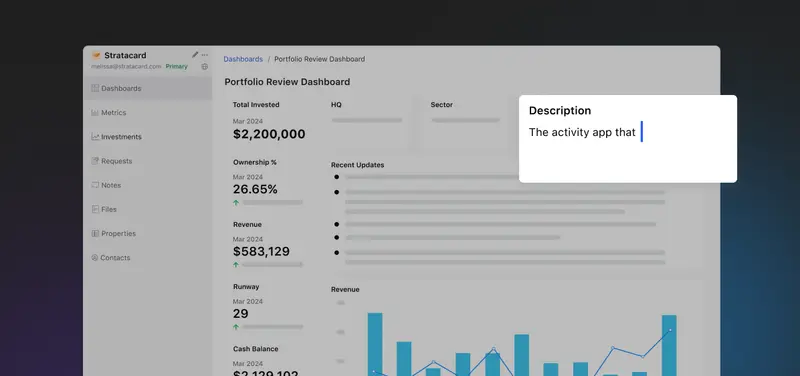
This update lets investors quickly edit the property values displayed on portfolio company dashboards. Examples of properties commonly updated include:
- "Recent updates"
- "Company description"
- "Notes"
- "Last discussed"
Giving users the ability to edit properties directly on a dashboard means investors don't have to navigate back and forth between the dashboards and properties section to make changes to their dashboards.


