Blog
Visible Blog
Resources to support ambitious founders and the investors who back them.
All
Fundraising Metrics and data Product Updates Operations Hiring & Talent Reporting Customer Stories
founders
Product Updates
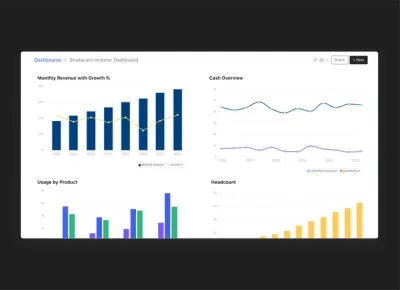
5 Steps to Build Your Dream Business Dashboard
Despite their popularity, most dashboards live up to only a fraction of their potential. In the first full flurry of enthusiasm for a newfangled technology, short shrift has been paid to how to design focused, thoughtful, and user-friendly dashboards.
Traditional dashboard design has tended to prioritize the right success metrics, only after which a hodgepodge of charts and a slew of gauges are stitched together in a mishmash single page. While the negative impact of such a design philosophy is curbed in small startups of three or so employees, it bodes poorly for any future expansion and development, when data naturally and exponentially starts to silo.
This article discusses five key strategies that founders and managers needs to keep in mind to make dashboard building and implementation effective.
1. Know Your Audience
Begin holistically: identify your target audience. Dashboards can be broadly categorized as strategic, analytical or operational. It’s difficult, if not impossible, for them to be all three at once. Tailoring your dashboard’s data to suit its single audience is key. Without a clear understanding of their requirements, you lack the ability to craft a meaningful message that resonates with your users.
Who is the dashboard’s end-consumer and what are their information requirements? Is the dashboard destined for financial monitoring by the executive team, or is it intended for daily analysis by the marketing team?
2. Avoid Clutter: Prioritize Data
Dashboards are easily cluttered. Given the tons of metrics that you could collect, and the space limitations of a dashboard, it’s imperative that you identify what data matters upfront.
Find the core. Your dashboard should have a core theme centering on a specific problem. A sales dashboard may ask “How can we make our pipeline more effective?” Or a marketing dashboard: “How can our marketing investments be optimizes?” Identifying this core will give you the logic for filtering superfluous information.
Thanks to your grip on your audience and their usage goals, you are better set to determine the focus of your interface design: key performance indicators (KPIs). Every application, from fitness trackers to powerful online analytics software, is built around a few KPIs. FitBit follows steps, calories in/out, and weight loss, while Google Analytics monitors conversions and traffic. Having KPIs in place ought give you a handle of the dashboard’s general tone and trajectory.
3. Keep It Clean, Keep It Simple
Variety for variety’s sake is categorically not the spice of dashboard design. Due in some part to their visual nature, designers have a tendency to ornament their dashboards with all sorts of visual distractions (for reference, check out this chamber of dashboard horrors).
Instead, restrict the aesthetic bells and whistles. Fewer extraneous graphics place focus right where it belongs: on the content.
For example, try to keep your color scheme simple: let green mean good and red bad. Adding in other colors like blue for improving, or orange for declining, quickly confuses things. Similarly be wary of piecharts! If the data falls in to a few simple categories, a pie chart can be effective. However, countless studies have testified to unreadability of the thinner pieces of a pie and their inability of communicate changes over time.
4. Make a story emerge!
It isn’t good enough to make the information available. If you want your data visualizations to be comprehensible and lead to action and change, you need to help tell a data-driven story. Begin by asking how the data will be viewed:
What story are you trying to tell?
Which data supports that story, and illustrates it most clearly for the end user?
Which specific data cluster is the user going to engage with most?
For example, ensure that data is displayed in logical groups. If a dashboard includes both Financial KPIs and Sales Pipeline, make sure to position the financial data together, while the Sales Pipeline data is displayed together in a separate logical bundle.
Similarly, the most important real estate on a dashboard – the top left hand corner – is typically earmarked for a company logo or a navigation tool. Given that most Western languages will read from top to bottom, left to right, that space should be a jumping-off point for most readers. It should be prioritized for critical data.
5. Put Perfectionism Aside
Ultimately, all thoughts of a silver bullet dashboard are idealistic. No dashboard is going provide every possible answer in a single view to an evolving business. Trying to do so only ends in a knotted web of choices, alternatives, and options for the end user.
Instead, it suffices that you know your users, you keep your data uncluttered, that your design is simple, and that you tell a story. With these four broad hallmarks of good data driven dashboard design, your developing business will be ready to generate relevant insights as it grows.
Ready to build your dream business dashboard?
Visible is the best way to tell the unique story around your company’s data, helping you keep everyone who matters to the business engaged in the business.
With the ability to create multiple dashboards, you can get even more granular about who you are presenting data to. Raising a new round? Build a “Potential Investors” dashboard to highlight some of your most important growth metrics. Looking to lean on industry best practices? Build a dashboard using one of our pre-made templates from firms like Andreesen Horowitz and Version One Ventures.
Start Your Free Trial

founders
Metrics and data
How to Calculate Net MRR
Learn How to Calculate Different Forms of MRR
This post is part of our Most Valuable Metrics series, helping your company understand how to develop a holistic framework for tracking your performance and telling your story to everyone who matters to your business. You can find previous posts in the series here:
Your Company’s Most Valuable Metric
How to Calculate Lead Velocity Rate (LVR)
Stealing the Right Growth Metrics for Your Startup
How to Calculate Bookings
What is your Investor Net Promoter Score?
How to Calculate SaaS Churn
How to Steal the Right Growth Metrics for Your Startup
Like every SaaS business, consistent subscription revenue is vital to your success. That’s why knowing your Monthly Recurring Revenue, or MRR, is so important. MRR is a measurement of the total predictable revenue you expect to make on a monthly basis.
Here’s a very simple example of MRR. You have three customers with the following subscription rates.
Customer X pays $75/month
Customer Y pays $50/month
Customer Z pays $25/month
Your total MRR is $75 + $50 + $25 = $150.
Net MRR gives your company a holistic overview of revenue gained from new subscriptions and upsells/upgrades and revenue lost from downgrades and cancellations.
MRR might not be part of GAAP (Generally Accepted Accounting Principles) or IFRS (International Financial Reporting Standards) but because of its importance in raising capital and gauging your sales and marketing success, it is crucial to understand and calculate correctly. Unintentionally misrepresenting your business to potential investors or developing your business plan on faulty data could spell disaster for your company.
To start, when calculating your MRR, do not include the following.
Full value of multi-month contracts: If you have quarterly, semi-annual, or annual contracts, normalize them to a monthly rate. Take the full subscription amount paid and divide it by the number of months in the contract. For example, your customer pays you $1,200 for an annual subscription. Dividing that by 12 gives you a monthly rate of $100 which you should use in your MRR calculation instead of $1,200.
One-time payments: One-time payments are not recurring, so you shouldn’t include them in your MRR calculation. One-time payments are not the same as multi-month payments. Even though a customer is paying a lump sum payment for those months, you expect the customer to make another lump sum payment at the end of the subscription period. With one-time payments, you don’t expect the customer to make another subscription payment.
Trialers: Until trial customers convert to being regular customers, don’t include their expected subscription values in your MRR calculation.
Now that you know how to determine your MRR and understand what should be excluded, you can calculate your net MRR. Net MRR includes the following:
New MRR: MRR from new customers
Expansion MRR: MRR from gained from existing customers when they upgrade their subscriptions
Churned MRR: MRR lost from existing customers when they downgrade or cancel their subscriptions
So, the formula for calculating Net MRR is:
Knowing the three elements of Net MRR is critical to understanding how your business is growing. Ideally your Expansion MRR should be greater than your Churned MRR each month. If it is, then you’re doing something right with your existing customers!
Want to read more on Monthly Recurring Revenue and how it impacts your business as your grow?
SaaS Metrics 2.0 – Detailed Definitions from Matrix Partners’ David Skok
Why most SaaS startups should aim for negative MRR churn by Christoph Janz of Point Nine Capital
SaaS Metrics for Fundraising from Intercom’s Bobby Pinero
Diligence at Social + Capital: Accounting for Revenue Growth from Jonathan Hsu

founders
Reporting
How to Find You Company’s Storytelling Framework
This post is excerpted from our first book, The Ultimate Guide to Startup Data Distribution. You can download the book for free and learn more about how other top companies are building and operating high-impact data distribution systems to keep everyone that matters engaged in the their business. Check out the other parts if you haven’t already:
Part 1. The Ultimate Guide to Startup Data Distribution
Part 2. Your Company’s Most Valuable Metric
Part 3. How to Find You Company’s Storytelling Framework
Part 4. ‘Steal’ the Right Metrics for Your Company (Coming Soon)
You can also find more on the topic of Startup Data Distribution here:
The 3 Key Pillars of Startup Data Distribution – OpenView Labs
How to Tell Your Company’s Story – Medium
The way that a company tracks and analyzes the key performance indicators around its product development and distribution as well as its customers and employees is key in determining whether its data distribution system will be effective and yield long term positive results. It doesn’t matter how often a management team communicates with team members, investors and any other stakeholders if the communication isn’t actionable and relevant to what drives the success of the business.
Blake Koriath, CFO at SaaS-focused seed fund High Alpha, likes to start wide when working with companies, focusing first on business model and company stage, then digging into exactly who will be viewing specific metrics and when.
1. Understand your Business Model
The way that you finance your operation, build your product, serve your customers, and generate revenue will be the primary driver behind what metrics you track. As Alistair Croll, one of the authors of “Lean Analytics” wrote, online businesses tend to primarily fall under one of the following business models:
He goes on to say that “no company belongs in just one bucket” as, for example, Amazon cares about “Transactional” KPIs when making sales on their site but looks to “Collaborative” KPIs when collecting product reviews.
2. Evaluate the stage of your business
In working with thousands of investors and operators over the last few years at Visible, we have come to understand the impact a company’s stage has on what metrics it should be tracking and how it should be tracking them.
Early stage teams may place more importance on things like cash in the bank and burn rate, hoping to extend the life of the business as they search for product/market fit and move from growth to scaling. Later stage companies, on the other hand, need to be much more qualitative in nature and understand how all of their different business units are contributing to their end goal as a business.
3. Determine who your intended audience is
When bringing a product to market, customer personas play a major role in things like pricing, messaging and feature set. When distributing key information about the performance of your business, stakeholder personas help inform which subset of metrics you present as well as when and how you present them.
Investors, according to High Alpha CFO Blake Koriath, are often interested in the highest level metrics, enough information to quickly understand general trends in the business and also understand where they can have the most impact. Overall Gross Margin, MRR Added and LTV are examples of metrics SaaS investors may be interested in seeing.
Executive team members fall next in the hierarchy and need to understand how the success of their team is contributing to the overall direction of the business (for example, Lead Velocity Rate for a a Sales Manager). Finally, team members are likely interested in the “atomic units” of those higher-level metrics. That is to say, how are their individual contributions bubbling up to impact the metrics that determine success for their teams?
Getting the right information to the right people at the right time is essential in telling the story around your company’s data. By focusing on targeted stakeholder personas, you can ensure that each group is empowered with the information they need to contribute most effectively to the growth of the organization.

founders
Metrics and data
Your Company’s Most Valuable Metric
This post is excerpted from our first book, The Ultimate Guide to Startup Data Distribution. You can download the book for free and learn more about how other top companies are building and operating high-impact data distribution systems to keep everyone that matters engaged in the their business. Check out the other parts if you haven’t already:
Part 1. The Ultimate Guide to Startup Data Distribution
Part 2. Your Company’s Most Valuable Metric
Part 3. How to Find Your Company’s Storytelling Framework
Part 4. ‘Steal’ the Right Metrics for Your Company (Coming Soon)
You can also find more on the topic of Startup Data Distribution here:
The 3 Key Pillars of Startup Data Distribution – OpenView Labs
How to Tell Your Company’s Story – Medium
To use a line from David Skok (the Godfather of SaaS metrics), “good metrics should be actionable and drive successful behavior.” To accomplish this, you first need to determine the end definition of “success” for your company. Since the mix of factors leading up to this point (Business Model + Stage + Audience), as well as the overall goals of every company, are different, there is no one size fits all approach to selecting your MVM.
The primary reason to have a single, holistic metric for your business is to cut out the noise that comes with trying to track (and take action on) everything so that you can hone in on the one thing that drives your success. Read any startup post-mortem and you’ll quickly realize the negative impact that lack of focus can have on a company. As you will see in the illustrations below, even growth stage and public companies often have a single MVM that they aspire to grow each period. In many cases, like with Airbnb or Meetup, the same MVM has been a guiding beacon since the early days.
Our Most Valuable Metric
At Visible, the metric most tied to our “success”, our MVM, is the number of companies we have actively using the platform on a monthly basis. The progress that we make on this metric helps us understand the performance of each one of our teams and can help us identify parts of the business bottlenecking our growth.
First of all, it gives us a good idea of how many people are coming in to the top of the funnel through different inbound and outbound channels then lets us know if our product is effective at “activating” those companies. Then, if a company is coming back to Visible each month to track and distribute their performance data, they are more likely to be inviting their investors, advisors and team members. As more companies in an investor’s portfolio begin sharing updates and metrics, the investor is more likely to become a paying customer. Similarly, team adoption within an organization grows as companies invite more employees.
In addition, since so many of the companies on Visible are what would be considered early or growth stage businesses, their continued expansion will bring new stakeholders into the fray, adding to the number of people who rely on us for the organization of their most crucial business data.
Related resource: Lead Velocity Rate: A Key Metric in the Startup Landscape
Early Stage Most Valuable Metrics
To give you some inspiration and help get you started, we’ve compiled a list of Most Valuable Metrics for top companies across a number of different stages and business models.
Whether you are interested in SaaS metrics like MRR (Buffer) or something a little less common, like Product Hunt’s “Product Page Visits,” you can do it on Visible.
Growth Stage Most Valuable Metrics
Even growth stage companies often have a single metric that everyone in the business – sales, product, customer success – focuses on growing each period. A holistic measurement of where the business is heading helps you tell your story more effectively and understand which supporting metrics are having the most impact on your growth.
Next Steps
Need help understanding what Most Valuable Metric is right for your business? We’ve created a series of posts that take a deep dive into some metrics that top startup companies are using to gain insight into their businesses.
Lead Velocity Rate (SaaS Metrics)
Bookings (SaaS Metrics)
Net Promoter Score
How to calculate churn rate (SaaS Metrics)
We will continue adding to this list each week so feel free to get in touch with any metrics you would like to learn more about.

founders
Operations
Product Hunt – 593 Days Later
Our First Time on Product Hunt
Back in the beginning days of 2014 Ryan Hoover shot me an email asking me to do an AMA on ProductHunt –at the time I still think it was a side project. (I’m user 1,077 #humblebrag)
I’m a sucker for product and community so was happy to help out. Also file Ryan’s email under things that don’t scale and how to build a community.
We launched Visible 1.0 on Product Hunt January 3, 2014, you can see the post and AMA here. The post got 93 upvotes I think we were near the top but honestly can’t recall.
We got some nice inbound from the post, definitely our largest day of traffic for Visible to that point. I don’t have any hard data on signups but do have the old app and marketing site Google Analytics profile.
Fast forward 593 Days.
Our Visible 2.0 release was featured on Product Hunt (find it here). We got 290 upvotes, finished 10th overall (the top hunt had 963 votes for reference) and we got 67 companies to sign up and become active on Visible. That number is impressive because we have a high barrier for a company to become active on Visible.
The day we were featured also ended up being our highest trafficked day in our marketing site’s history. Product Hunt referrals ended up over 235% from the first feature 593 days ago.
Other Notes:
While I’m incredibly impressed by the traffic and growth Product Hunt sent and the growth of the community, I thought the number was a little low. There are some factors like us not being in the Top 3, we didn’t heavily market it, etc.
However, after some quick digging I remembered that Product Hunt used to directly send you to a Hunt URL. This is represented as a “/” in the Referral Path in GA.
Today it takes an additional click on the “Get it” to get to a hunt. This totally makes as they want you to stay in the PH community, engage, etc. I’d be curious what would happen if they still directly sent you to the site!
Feel free to email me any questions about launching on Product Hunt.
Up & To the Right!
Mike

founders
Metrics and data
The Ultimate Guide to Startup Data Distribution
This post is excerpted from our first book, The Ultimate Guide to Startup Data Distribution. You can download the book for free and learn more about how other top companies are building and operating high-impact data distribution systems to keep everyone that matters engaged in the their business. Check out the other parts if you haven’t already:
Part 1. The Ultimate Guide to Startup Data Distribution
Part 2. Your Company’s Most Valuable Metric
Part 3. How to Find Your Company’s Storytelling Framework
Part 4. ‘Steal’ the Right Metrics for Your Company (Coming Soon)
You can also find more on the topic of Startup Data Distribution here:
The 3 Key Pillars of Startup Data Distribtion – OpenView Labs
How to Tell Your Company’s Story – Medium
How do you tell your company’s story?
Being able to effectively tell your company’s story has never been more important. As a company grows, it acquires more stakeholders – employees, investors, advisors – who need to remain engaged in the business in order to play their role most effectively. When those different stakeholders are empowered with the right information, it leads to better communication between teams, more introductions from investors to potential customers or employees and an overall culture of transparency that endows a feeling of ownership that stretches beyond what shows up on a cap table.
What is Data Distribution?
Data Distribution describes the systems and processes a company has for gathering key performance metrics and getting them to the right people at the right time in order to support the company’s growth. How your company builds your specific data distribution philosophy centers around how you want to tell your company’s story and who you want to tell that story to.
In short, Data Distribution is how well your company turns this…
Into this…
Why is Data Distribution Important?
Taking a company from its first round of funding to ultimate success (define that how you will) is no easy task. Companies fail for a number of different reasons and one of the more inexcusable is a breakdown in communication between founding teams, CEOs and investors, or leaders of different teams within in organization.
Building a solid process for your company’s Data Distribution means professionalizing the way that you approach communication to your stakeholders. There is a responsibility that comes with deploying capital for others (often millions of dollars) and employing people (often dozens) to help build your vision. Marc Andreessen touched on this responsibility in a recent interview with Fortune’s Dan Primack.
How can I implement Data Distribution at my company?
The way that a company tracks and analyzes the key performance indicators around its product development and distribution as well as its customers and employees is key in determining whether its data distribution system will be effective and yield long term positive results.
Blake Koriath, CFO at SaaS-focused seed fund High Alpha, likes to start wide when working with companies, focusing first on business model and company stage, then digging into exactly who will be viewing specific metrics and when.
Once you understand this and are committed to the idea of building out a data gathering system, your next step is to actually select the full set of metrics that make sense for your company. This is where things can get complicated, as there are hundreds of metrics to choose from as well as different time frames to consider and different ways of calculating certain metrics. Additionally, the amount of data produced in a growing technology company can be overwhelming for teams and founders.
Luckily, many thorough frameworks – crafted through years of experience by top investors and founders – already exist and can give you a great baseline to work from, no matter your business model or stage (we dive in depth into many of them in the book).
Remember, as Pablo Picasso whose paintings even most VCs can’t afford is credited with saying, “great artists steal.”
Many thanks to Nick Podraza for the awesome image. Check out more of his stuff here.
Where can I learn more about Data Distribution?
We thought you might ask. To start, you can download The Ultimate Guide to Startup Data Distribution, the first book we’ve ever published here at Visible. The book contains 40 pages of tactical insight to help you and your team tell the story around your key performance data more effectively.
Get the Book for Free
After you’ve read the book, get in touch! We’d love not only your feedback but also to spend 10 or 15 minutes on the phone sharing some of our learnings and helping your company get set up with an effective Data Distribution process. Shoot us an email and we’ll get back to you asap to get something set up!

founders
Product Updates
Innovate, Don’t Duplicate: Why We Rebuilt Visible from the Ground Up
You will hear it from almost every developer: “I could do it better (and faster)”. Refactoring or rewriting an application is developer porn. You explore new technologies, update your stack, redefine the architecture… all these excite our reptilian brains. So great, let’s rewrite the application! But wait… we are still trying to nail our product/market fit, we are still growing the company, we have a legacy application running, we have a customer expecting updates… are we really doing this?
Owning the code base
The Visible 1.0 code base was over 1.5 years old and had been written and maintained by different contract developers to build the prototype while we searched for product/market fit. The code was ok, it worked, but none of the contractors were full time employees of the company. We faced a big challenge of building an engineering team of 3 or 4 people that owns the codebase just as we started to get validation that we were on to something.
Our team was aware and knowledgeable of the technical decisions that were made in Visible 1.0 but there was very little documentation; as to be expected in an MVP. Whether we would have started from scratch or tried to improve the existing code, we needed to know the entire code base through and through to onboard new team members. Additionally, it is definitely easier to document and know the code you write than the code you read. And it is true for every recruit, so the gain here is multiplied by the size of the team. Rewrite 1 – Reuse 0
Running the business
This was the biggest concern surrounding a rewrite, no question. How could we run the business during the rewrite when we have customers relying on the existing version? It was out of the question for the engineering team to support the old version while creating the new one. It would have meant twice as much work and supporting two versions is never fun. As a result of this decision, the company would be effectively split in two, the business team would keep working with the legacy software (supporting existing users, getting new ones) and the product team would develop the next version. Having two separate teams isn’t ideal when you are trying to build a united company! We actually underestimated the impact it can have on both the morale of the business team, waiting on the next version and on the engineering team, whose stress level keeps growing as time goes. Rewrite 1 – Reuse 1
Managing expectations
“When a developer gives you an estimate, multiply it by 2 or 3.” You are really putting the entire business in a sort of limbo out of which you hope to get out as soon as possible. There is always the battle between unrealistic deadlines and overly conservative ones. Everyone wants to release as soon as possible but a rewrite will always include unexpected bugs and problems. The schedule will slip and the more it does the more the tension builds. I can’t stress how much a full rewrite is a gamble and you must take that into consideration. Ask yourself, what if the 3 months become 6? 7? 8? It is an expensive decision for an early stage company, make sure to consider the worst case scenarios! Rewrite 1 – Reuse 2
Investing in the future
The last thing we wanted to do was go through this process in the next 3+ years (hopefully ever). We took a particular care building a strong technology stack. Stay tuned for more technical posts but the main idea is that we now have a separate Ruby API and a Ember web client. It will allow for a lot more flexibility in the future. E.g. opening the API to our users, native mobile apps, etc. It’s documented, tested and fun to work in… All of which are important when scaling a tech team, product and company. This is an investment in the future with returns that will hopefully compound in the future.
If you do not tackle technical debt as you go, it will backfire. And since Visible 1.0 was built as an MVP, always evolving and changing in different directions, had a lot of it. We estimated that if we rewrote the code base, with a strong attention on limiting the code debt, we would be at least twice as productive within 12 months. It is impressive what a good technology stack can do to morale and productivity! Rewrite 2 – Reuse 2
Innovate, don’t duplicate.
We didn’t duplicate the old Visible and just change out the engine. We rethought Visible from the ground up based on all of the feedback from current users, potential ones and where we see the product going. It means that Visible is now at least twice the product it once was, it has an entirely new interface and we doubled down on functionality of our most used features. A good part of the past 6 months was actually spent on changing the core architecture; for instance to allow metrics for quarterly (or any frequency) metrics! You can read about the new features in our release article. Rewrite 3 – Reuse 2
Conclusion
Looking back, it was the right decision to rewrite Visible. It took a lot longer than we first estimated, it was a lot more work and stress than we expected but we pulled it off as a team. We got a lot of great feedback, both positive and negative and are already back at work to improve the product and fix the bugs. And the good news is that you will no longer have to wait month before getting them.

founders
Reporting
Should You Send Investor Updates?
How to Determine if You Should Send Investor Updates
So you just raised your first round of funding. Or closed your first big customer. Or launched your product. Congrats! Now what?
Well, if you are like us and like thousands of other early and growth stage companies, it is probably time for you to start thinking about your process for getting the right information to the right people at the right time. With the amount of data you have coming in from your customers, your tools and your employees, it can be a bit overwhelming so having a clear understanding of the benefits of implementing a repeatable process can be a great place to start.
Related Reading: How To Write the Perfect Investor Update (Tips and Templates)
Luckily for you, we built a little guide to help you understand the importance of stakeholder engagement, namely investor updates. Consider it a choose-your-own-adventure guide for the modern founder. If you would like, you can download PDF right here.
Want to read more about keeping the people that matter to your business engaged and informed? Here are a few great places to start:
The Visible Reading List – Our curated collection of the best content from top investors and entrepreneurs about the how and why of stakeholder engagement
Why Update Your Investors? – Some ideas on what you should track and how you should track it
Is Radical Transparency the Way Forward for Startup Marketing? – Transparency plays a big role in keeping your stakeholders engaged.

founders
Operations
Why Most Accelerators Fail…and Why Yours Doesn’t Have To
Earlier this year, we asked top early stage investors for their opinions on the future of accelerators and their answers stood in stark contrast to their views on the rest of the market. While they were optimistic on the general state and future of the early stage market (although the Series A crunch worried many), their outlook on accelerators was overwhelmingly bearish.
Image via Q1 2015 Sentiment Index Report – Download for Free Here
After receiving funding from accelerators, companies often receive their next round of funding from seed stage firms, the so called “Micro VCs”. Firms of this type had a record year of fundraising in 2014, meaning that plenty of capital is available in the market for companies at the stage.
However, this doesn’t mean that the fundraising process is any easier for accelerator backed companies than it is for ones that haven’t gone through a program. In fact, because of the way perceptions are forming among later stage investors, it may be getting harder
“There are too many incubators and that has hurt them all. Too many entrepreneurs think if they get into an incubator they have accomplished something. They haven’t. It’s a false sense of confidence. Call it incubator inflation.” – Mark Cuban in a 2014 Triangle Business Journal interview
Last week in Montreal, our team attended AcceleratorFest, held a day before the well known StartupFest that draws in top entrepreneurs and investors from across the globe. Sustainability seemed to be on the minds of many at the event, with a panel focused on the topic as well as separate breakouts intended to help facilitate discussion among industry leaders around what approaches and platforms can help contribute to the long term success of a nascent accelerator.
Related resource: The Top 16 Accelerators Powering Startup Growth
1. Understand what value you are adding to the companies entering your program
The world and it’s high growth companies don’t need another one size fits all accelerator. This is something that was clear in our earlier survey of investors and also to conference attendees. Without a world class brand behind it (see: YCombinator) an accelerator with too wide of a focus will only end up getting second tier companies in their respective industries and verticals.
500Startups, whose Elizabeth Yin was a speaker at the conference, has carved out a successful niche by helping companies focus on product distribution and growth. They have done this by developing a strong set of subject matter experts and a quantifiable framework that companies follow throughout the program. (AARRR) Companies enter the 500Startups program knowing that they are going learn how to more effectively acquire customers and the firm delivers on it promise.
Another example of this targeted approach is the Fashion Technology Accelerator. With offices in San Francisco, Milan, and Seoul, they are able to expose companies to the world’s hubs of high technology and high fashion, helping form valuable connections with suppliers, distributers, and technical talent.
Related Reading: What is an Incubator?
2. Prioritize alignment among all of your key stakeholders
One thing that is not often discussed is the importance of understanding the motivations (and performance) of everyone involved in your program – companies, LPs, mentors and your own team.
Successful alignment comes from being able to successfully tell the story around the purpose of your firm as well as the performance of the companies in your programs. Your goals as an accelerator leader dictate the story you tell to the LPs funding your accelerator as well as to the companies you are targeting.
Once companies are in your program, the focus shifts to empowering the founding teams to understand and tell the story around their key data. This helps increase the odds of success in post-program fundraising and supplies you with the information you need to keep your own backers engaged in your progress. Alignment from top to bottom (and bottom to top) drives sustainability.
3. Build a “Startup Compost”
In the aforementioned panel on sustainability in the accelerator market, Sylvain Carle of Montreal-based accelerator Founder’s Fuel coined a new term to help program leaders understand how they should work most effectively with the companies in their programs that will inevitably fail. He calls it “Startup Composting”.
Accelerators spend a lot of time (and money) educating founding teams and setting them up for future success. Unfortunately, that success often comes too far in the future for the accelerator to see much benefit.
To run an effective “Startup Composting” program, it is crucial to understand exactly how all of your companies are performing (both while in the program and after) so that you can help teams understand when it may be time to pivot to a new business model or think about blowing things up and either starting fresh or joining forces with one of your other teams whose company is on a more likely path to success.

investors
Operations
The Tech Investing “Software Stack”
Software Stack for Investors
Every week our team collectively talks to hundreds of investors and startups. We frequently hear about the tools they are using and the tools they would love to have. We also get a lot of people asking for our opinion on what CRM they should be using or wondering what Investor Y is using for their back office.
Over time we’ve saved all of these data points and have created the tech investing “software stack”. It buckets various products into categories such as CRM, Databases, Back Office, etc. Find it below! Please note: the logo sizes or hierarchy don’t reflect company size, performance, etc.
Want the PDF version? You can download it here.
Think we missed something and want to see it added? Mention us and the post at @VisibleVC

founders
Operations
The 16 Best Startup Newsletters
For people involved in the world of startups, determining what content sources to trust and what outlets to read can be a daunting task. Tech blogs, company blogs, VC blogs, Medium. Add to that the fact that people at early-stage companies tend to wear multiple hats and are looking for tips and tactics to help them excel in all of their roles and it seems like the firehose of information never stops. So how do you separate the signal from the noise and make sure you aren’t spending all of your time finding good stuff to read instead of taking action on the learnings?
Related Resources: Our 15 Favorite Newsletters for Startup Founders, 6 More Great Startup Newsletters, How To Write the Perfect Investor Update (Tips and Templates)
Startup newsletters are a great place to start and we have put together a list of some of our favorites to help you spend less time browsing for content and more time learning from peers and others with something interesting and important to say.
Industry News & Curated Reading Lists
First Round Review
Whether your job is to build product, make sales, build community or do just about anything else that comes with building an early-stage company, you will find the First Round Review extremely useful. By using stories from First Round portfolio companies, the First Round review shares valuable lessons and does so with high production quality.
Why We Love this Newsletter
We love the First Round Review because of the first-hand stories. The team surveys and interviews the best leaders in the space to uncover stories and strategies to help startups at any stage grow.
SaaS Weekly from Hiten Shah
Hiten Shah is the founder of CrazyEgg and KISSmetrics (and now a startup podcast co-hosted with Close.io’s Steli Efti) so he know’s his stuff when it comes to growing a SaaS business. In his weekly newsletter, Hiten organizes SaaS focused content by category for easy reading no matter one’s job title or expertise.
Why We Love this Newsletter
Hiten offers a great look into the SaaS world by drawing on his own experiences from building some of the most successful Saas companies.
Related resource: 11 Top Industry Events for SaaS Startups
Benedict Evans’ Newsletter
As Benedict Evans, a Partner at a16z puts it, the newsletter (delivered every Sunday) covers interesting developments in tech and mobile (globally) along with commentary on what it means for the market.
Why We Love this Newsletter
Benedict Evans is a bonafied thoughtleader in the space and offers good insights into the market in general as well as macro trends.
Work-Bench Enterprise Weekly
With links, events, and funding rounds focused specifically on the sector, the Enterprise Weekly – produced by venture fund and startup community Work-Bench out of New Your City – gives you everything you need to stay up to speed on the world of enterprise tech.
Why We Love this Newsletter
The Work-Bench Enterprise Weekly newsletter covers all things related to the enterprise world. They offer resources and insights as well as recent news and fundings in the space.
The Visible Weekly Newsletter
We search the web for the best tips to attract, engage and close investors, then deliver them to thousands of inboxes every week. We share everything to help founders succeed — everything from fundraising to mental health. Subscribe here.
Why We Love this Newsletter
We might be bias (as the Visible Weekly is our newsletter!) but we pride ourselves on curating the best content from investors and founders in the startup space to help founders grow their business.
The Founder Playbook by Hustle Fund
As put by the team at Hustle Fund, “The Founder Playbook is all about tactics. Specifically, tactics around fundraising and growing your startup. We cover things like:
What metrics you should know before you pitch an investor
How to grow an audience when you don’t even have a product yet
And how to write a kickass cold email”
Why We Love this Newsletter
The team at Hustle Fund are well rounded in all things growth and fundraising. The Founder Playbook is full of some of our favorite fundraising tips as well as growth strategies for early stage startups.
The Hustle
The Hustle is full of trending topics in the tech space. While not the strategic advice that other newsletters on this list offers, The Hustle offers compelling stories and trends in the space.
Why We Love this Newsletter
The Hustle has the scoop on some of the most insightful, and entertaining, stories in the tech space. By having a pulse on the space, you’ll be able to better understand macro trends.
Startup Funding & Venture Capital Newsletters
CB Insights
High-quality, data-driven insight into what is happening in the world of early-stage funding and company building, always delivered with a bit of an edge and a dash of humor. The CB Insights Newsletter is packed with sector specific research, breakdowns on emerging markets and companies, and insight into how the early-stage market is transforming.
Why We Love this Newsletter
The CB Insights is full of data-driven stories written with a level of humor. The daily newsletter is packed full of data, stories, and trends in specific sectors.
StrictlyVC
Interviews, funding updates, news on key personnel developments at top companies. StrictlyVC gives you a concise daily rundown of everything that you need to know about what is happening in the startup and venture world.
Why We Love this Newsletter
StrictlyVC is our go-to newsletter when it comes to news with startup fundings and acquisitions. The daily newsletter highlights any new fundings, acquisitions, and hits on major stories.
Term Sheet
While Term Sheet, from Fortune’s Dan Primack, tends to focus more on the growth stage and private equity markets, it is still a crucial bit of reading every weekday morning. Know what companies raised, who the new funds on the block are, and understand how developments in other stages of the private markets could impact your business.
Why We Love this Newsletter
Similar to StrictlyVC, we love Term Sheet because of the quick hits on news and the reliable data on funding and acquisition news.
Growth & Marketing Newsletters
TenSpeed Newsletter
TenSpeed helps companies growth with content marketing and SEO. As they put on their website, “Every month, we share tactical advice on one topic, plus the best of our blog content and latest podcast episodes, all in one place. Take your content marketing efforts the extra mile by signing-up below.”
Why We Love this Newsletter
The teammembers at TenSpeed are total pros in all things content marketing. Their monthly newsletter comes full of indepth resources and guides to help take your content marketing to the next level.
Kyle Poyar’s Growth Unhinged
Kyle Poyar is a partner at OpenView Ventures. Kyle has been a huge proponent of product led growth and uses his newsletter to share new learnings and insights from his own research and portfolio companies.
Why We Love this Newsletter
Kyle Poyar offers some of the best advice when it comes to product led growth for SaaS companies. The newsletter is full of strategic advice to help SaaS companies fuel growth.
The Blend by The Juice
The Juice is the world’s largest library of sales and marketing resources. As a team that curates the best growth content, their newsletter is full of their favorite takeaways and lessons in content marketing.
Why We Love this Newsletter
With a skilled team of marketers, the team at The Juice puts together great insights when it comes to all things content marketing.
Design & UX Newsletters
Sidebar
A simple concept…the 5 best design links, in your inbox, every single day. No fluff, just a quick, easy way to receive a curated list of interesting articles, videos and projects about the world of design.
Why We Love this Newsletter
The Sidebar newsletter is a great daily newsletter to stay up to date with the best in design. The newsletter is simple and easy to digest.
InVision Weekly Digest
InVision is an indispensable tool for many designers, product people and marketers. With a subscription base of over 800,000 designers, the same can be said for their weekly newsletter, which shares useful tactics for creating better products and give a behind the scenes look at how some of the world’s best design teams bring ideas from concept to market.
Why We Love this Newsletter
As one of the most popular design tools, the team at InVision is full of insights and tactics that are useful to seasoned designers or founders doubling as a designer in the early days.
One Design Company Weekly
One Design Company is a Chicago-based design, strategy and development agency that puts out an awesome weekly email packed with fun links, food for thought and some of the most useful posts on design and development from around the web.
Why We Love this Newsletter
The One Design Company newsletter offers fun and insightful posts on design and development that will keep any designer engaged.
Subscribe to the Visible Weekly Newsletter Today
Building a startup is difficult. Turning to the resources, leaders, and peers that have been there before is a great way to learn on the fly. To stay up to date with what our favorite investors and founders are staying in the space, subscribe to the Visible Weekly.
Related Resource: 10 Foodtech Venture Capital Firms Investing in Food Innovation
We search the web for the best tips to attract, engage and close investors, then deliver them to thousands of inboxes every week.

founders
Operations
What We Talk About When We Talk About Startups.
If you are anything like our team here at Visible, you bookend your days at the office with StrictlyVC and the Mattermark Daily. Over time, both have proven to be extremely useful sources of startup content – StrictlyVC opens things up with the day’s funding news (and great interviews) and Mattermark closes things out with thoughtful pieces from investors and operators for the ride home.
Related Reading: Business Startup Advice: 15 Helpful Tips for Startup Growth
Mattermark’s founder, Danielle Morrill launched the newsletter almost 2 years ago aiming “to provide a weekly rundown of interesting events, data, and insights from the startup world”. It has since turned into a daily publication that has featured over 1500 different articles from founders and investors sharing tips and insight on everything from designing products to dealing with the difficulties of running early stage companies
What the Startup World Writes About | Create infographics
We utilized Import.io to comb through the Mattermark Daily archives and analyze the headlines of all of the articles from over 190 editions of the Daily. Not surprisingly, words like ‘Startup’ and ‘VC’ were among the most common while the remaining words on the list paint an interesting web of all the things people in the startup ecosystem (some would say echo-chamber) think about and discuss on a daily basis.
Markets and Models | Create infographics
Building a company is uncharted territory for first-time founders, people early in their careers and those entering new markets or exploring new business models. Luckily for advice seekers, especially those hoping to understand and grow SaaS or Mobile businesses, there was plenty of great content to choose from.
50 Shades of Green | Create infographics
How can we raise, spend and eventually make money? How come you keep asking me for money…and why aren’t you a unicorn yet? These are some of the things that founders and investors, respectively, focused on as hundreds of posts throughout the Mattermark archives feature thoughts on raising funding, exit opportunities and everything that happens in between.
People | Create infographics
If there is one thing we learned with this exercise, it is that VCs have a bit of a tendency to talk about themselves. Some of it is navel gazing, sure, but most provide an interesting peek behind the VC curtain or words of advice for founders looking to raise money, make key hires or scale their businesses.
PG & @pmarca | Create infographics
It is no surprise, with the ubiquity of YCombinator and the continually growing relevance of A16Z, that Paul Graham and Marc Andreesen share the top spot for most mentioned individuals. Add that to the list of examples showing how much weight people in the technology industry place on the opinions of top investors.
Women in Tech | Create infographics
Women in technology, one of the most important issues facing the industry, featured heavily in Mattermark’s archive with a primary focus on profiles and interviews of women in technology leadership positions working to inspire the next generation of female CEOs, investors, hackers and painters.
Companies | Create infographics
People loved writing and reading about the companies that make up the technology world, either as examples to follow or in response to various controversies or product launches. The posts from the last couple years heavily feature companies leading the growth of the early stage ecosystem (Y Combinator, Angellist, A16Z), ones embroiled in controversy on their way to massive growth (Uber & Snapchat) and one-time darlings that have since fallen on harder, or at least less rocketshippy times (Square & Foursquare).
Attention Grabbers | Create infographics
Want to get into the Mattermark Daily? Your best bet is to go with a ‘How to” headline. The other apparent way in is by being Tren Griffin, whose posts on lessons learned from leaders in Technology (Sheryl Sandberg & Jeff Bezos) and Finance (Warren Buffett & Ray Dalio) offer instructive frameworks for how to make decisions and build better companies which at the end of the day is what most people in the startup universe care about.

founders
Hiring & Talent
A Guide to Building Successful OKRs for Startups
Raise capital, update investors and engage your team from a single platform. Try Visible free for 14 days.
Quick Navigation
What does OKR stand for?
Where does the OKR framework come from?
Benefits of Using OKRs for Startups
Common OKR Challenges
Common OKR Mistakes
When should you start building OKRs?
How to Track OKRs
Try OKR Templates with Visible
What does OKR stand for?
In order to move forward at a startup, leaders need to be able to measure and improve upon all aspects of the business. Staying focused on near-term goals while working towards a larger company vision is a surefire way to keep everyone aligned. To help with this, more teams are turning to OKRs (objectives and key results).
According to Christina Wodtke, “OKRs comprise an objective—a clearly defined goal—and 3–5 key results—specific measures used to track the achievement of that goal.” Each objective is supported by initiatives — the steps that will help a team achieve the key results. OKRs are made up of 2 major components:
Objectives
An objective is a clearly defined goal that you would like to achieve by the end of a period. An objective should tie to both the team’s overarching mission or goal as well as the individual’s personal goals.
Key Results
Key results are the actionable and quantifiable steps you can take to accomplish an objective. Each key result should be measurable and applicable to the objective.
Related Resource: Startup Metrics You Need to Monitor
Examples of OKRs for Startups
As we’ve mentioned, OKRs are widely used so we have plenty of examples to pull on. The most famous one being Google.
Google
Google didn’t invent OKRs but they have become synonymous with the goal-setting framework. The team at Google runs OKRs like a well-oiled machine. Rick Klau, previously of Google, breaks down how they used OKRs below:
“Though the video goes into more detail, here are a few keys to what makes OKRs work at Google:
Objectives are ambitious and should feel somewhat uncomfortable
Key Results are measurable; they should be easy to grade with a number (at Google we use a 0–1.0 scale to grade each key result at the end of a quarter)
OKRs are public; everyone in the company should be able to see what everyone else is working on (and how they did in the past)
The “sweet spot” for an OKR grade is .6 — .7; if someone consistently gets 1.0, their OKRs aren’t ambitious enough. Low grades shouldn’t be punished; see them as data to help refine the next quarter’s OKRs.”
Swipely
In 2013, Swipely was rapidly scaling and their CEO, Angus Davis, had a feeling their culture and alignment was beginning to suffer. Davis turned to OKRs to improve their productivity, culture, and alignment as they went from 30 to 80 employees.
Since then, OKRs have become an integral part of communication and culture at Swipely. In an article with First Round Review, Angus Davis shares the example below
“Paul, a member of Swipely’s engineering team
Objective: Ship [X] feature to increase engagement.
Description: Our [X] will allow merchants to access Swipely anywhere, increasing engagement, value, and differentiation which will reduce churn and differentiate our offering with an exciting new value proposition.
Alignment: A company-wide objective is to “Become a ‘must-have’ tool merchants love to use,” which has a key result, “Ship [X] product to increase engagement and drive excitement in the sale.” The individual objective to ship [X] is aligned with this company-wide objective.:
Key Results:
Deliver alpha version to targeted devices for alpha testing feedback from 10 early customers by [date: mm/dd/yyyy].
Provide screenshots/screencast to support marketing launch of the app by [date: mm/dd/yyyy].
Release beta version by [date: mm/dd/yyyy].
Achieve engagement DAU / MAU metric of [X] with beta audience.”\
We love how the team at Swipely encourages individuals to write out their own objective alignment to those of the entire organization.
Where does the OKR framework come from?
OKRs are generally believed to be introduced by Peter Drucker, the father of modern management, in the 1950s. Since then they’ve been tweaked, renamed, and made popular by other business leaders. Andrew Grove is regarded as the “Father of OKRs” for introducing OKRs during his time at Intel.
However, OKRs took the startup world by storm when introduced at Google. John Doerr of Kleiner Perkins (VC firm that invested in Google) took the idea to Larry Page and the Google team and the rest is history. As Larry Page put it, “OKRs have helped lead us to 10x growth, many times over. They’ve helped make our crazily bold mission of ‘organizing the world’s information’ perhaps even achievable. They’ve kept me and the rest of the company on time and on track when it mattered the most.”
Benefits of Using OKRs for Startups
While you may be thinking to yourself, “OKRs are just another acronym,” they have a proven track record and can genuinely help move your business forward.
Business Impact
Larry Page credits OKRs for fueling growth at Google. As Peter Drucker put it, “If you can’t measure it, you can’t improve it.” By having a system in place, like OKRs, to measure and track your efforts, you will greatly improve your odds of improving all aspects of your business.
Communication Impact
When implemented correctly, OKRs can be more than a goal-setting framework for a startup. They have the ability to be a communication tool that can help both individuals and the company move forward. As put on “The Fundamentals” blog,
“As a communication tool, OKRs bring two key things to an organization:
Easily digestible direction such that every member in the organization understands how they contribute to the mission; aka focus
Expectations amongst teams and their individual members; aka accountability”
Increased Focus
Objectives and key results can bring an increased focus to both individual and company-wide goals and missions. For example, if management and leaders have a clear set of OKRs for the organization and individuals across the company set their own OKRs (that tie to the high-level OKRs) everyone will be working towards the same big goal.
Having each individual be able to articulate why their objectives will help towards the greater company mission is a great way to make sure that everyone is focused across the company.
Common OKR Challenges
Implementing a new goal tracking (and communication) framework is naturally a challenge for any startup. Luckily, OKRs have been implemented by large corporations and small startups so the challenges are predictable and well documented.
Lack of Cooperation
Naturally implementing a new goal-setting framework will come with some pushback as daily workflows change. The team at FirstRound Review offered a deep dive into how Swipely uses OKRs. Their CEO, Angus Davis, is a major proponent of using OKRs. As they put it, “Davis checks in on his immediate reports every week, and encourages his leadership to do the same. They believe people should be held publicly accountable for failing to regularly update their OKRs, and Davis even shapes his management meetings around them.”
Having leadership that believes in OKRs is vital to success, which brings us to our next point…
Wrong Leadership
Having the leadership in place to set and monitor OKRs is vital. If management and leadership are passively tracking their objectives chances are the rest of the team will follow suit. Leadership can help cement the importance of OKRs by fitting them into daily workflow and conversation or using them as the talking points of team meetings.
Misaligned Values
At the end of the day, alignment is a major benefit of OKRs. Being able to document and articulate how individual OKRs are aligned with company OKRs is important to implementation and success. In part of having the right leadership in place, they need to be able to set the values and mission of the company so individuals can easily explain (and see) how their objectives are helping the company move forward as a whole.
Common OKR Mistakes
Building OKRs in a Silo
One of the main benefits of OKRs is to eliminate silos in the workplace. In theory, everyone should be tied to the company’s values and missions. However, implementing OKRs incorrectly can still lead to workplace silos. If leaders and managers are only using their input and analysis to build OKRs, individuals will likely suffer and feel isolated. When building OKRs, make sure to incorporate input from everyone in the organization and allow them to set and tweak their own objectives.
Key Results are Too Aggressive
There is a fine line between making a key result too aggressive and a reasonable stretch goal. As Angus Davis, CEO of Swipely puts it, ““They have to be a stretch.” Most people wouldn’t consider 70% to be a good grade, but for OKRs that’s just about perfect, Davis says. You want your objectives to be ambitious enough to push you beyond your limits. When everyone does this, it forces the tough conversations about what’s truly needed to beat expectations.”
However, you do want to make sure that 70% or more is achievable. If individuals are constantly hovering around 50% or less of their key results, it might be time to re-evaluate and set new key results.
Inaccurate Tracking
Tracking and measuring are vital for implementing OKRs. If you do not have a system in place to track, measure, and improve your existing OKRs, they will not work. On top of having a system in place, you also need to have a source of truth for where the actual data is coming from. For example, if a key result is measuring new leads, you’ll want to make sure it is coming from the correct source. We share best practices below for tracking your OKRs.
When should you start building OKRs?
Different companies operate their OKR setting and reporting differently. Generally, most companies use a quarterly basis but there are certainly examples of monthly or annual OKR cadences as well.
Ultimately it depends on the needs of your business. If it is fast changing and you are rapidly tweaking and changing things, a monthly or quarterly cadence might work best. If things are solidified and you absolutely know what you need to focus on, a longer cadence might work best.
How to Track OKRs
Being able to measure and track your OKRs is vital to success. Without a system in place to track OKRs, you will never know how to improve.
Track in the Open
OKRs have the opportunity to be a communication system (on top of a goal-setting system). When tracked in the open, it will ensure that everyone in the organization is rallied around their common goals and objectives. It can be an easy way to demonstrate how everyone is impacting the business as a whole.
As the team at Lumeer put it, “Share them with your employees and co-workers so that they can actively participate in achieving them. Make sure that everybody can see the current status and track the OKR.” Check out our Google Sheet & Update Template to share your OKR progress below:
When tracking in the open, make sure to be mindful of the individuals. As OKRs are generally stretch goals, some individuals and teams may miss the mark as they should not be punished. Use this chance as an opportunity to improve goal setting in the future.
Related Resource: The Startup Metrics Potential Investors Want to See
Check-in Often
As we mentioned earlier, the likelihood of successfully implementing OKRs is improved when leaders and managers actively engage with teams about their OKRs.
If you miss a weekly goal it becomes difficult to achieve your monthly goal which makes it challenging to make up for your quarterly goal. We encourage leaders to check in with their direct reports on a weekly basis to review OKRs. Ideally, this will trickle down throughout the organization.
Reevaluate
As we mentioned earlier, OKRs are generally stretch goals. If you miss by a wide margin it is important to reevaluate at the end of the period and see (a) where you missed the mark and (b) how you can improve goal setting for the next period.
Try OKR Templates with Visible
We’ve built a free Google Sheet template to help track your objectives and key results below:
Follow the instructions in the first tab of the sheet to start your OKR journey. From here, easily connect the sheet to Visible to automatically chart your key result progress. Check out an example of a Visible Update used to share OKRs here!
founders
Reporting
Managing Investor Relationships & Updates
This was originally guest posted on BoomTownBoulder
All great relationships have one thing in common: communication. Open and honest communication is the key to any fruitful relationship.
So why should your investor relationship be any different? Great entrepreneurs have an open dialogue with their investors and are able to get the most from them.
However, at Visible we constantly hear about companies going silent after the money is wired.
Why? Here is my hypothesis: startups are hard. This isn’t earth shattering news, but when you start to look into the head of an entrepreneur it will make sense why they have communication problems with their investors.
When you are a CEO/founder/entrepreneur, your view of the world is just your company. Your “portfolio” is 1 of 1, so to speak. Updates to your business are typically not amazing. Instead of providing regular updates about the business, a founder will wait until they have amazing news to share. The amazing news never comes, the founder has been silent for 6 months and has 45 days of cash left.
Who is more likely to get the bridge round of financing? The founder who has been providing regular updates and correcting course when needed or the one who has been silent for 6 months and has no cash left…
It’s always scary to share bad or mediocre news but it is what the great founders do. Why? Because they realize that they can extract value from their investors outside of just capital. An investor’s view of the world is one of many. They have seen failure, success and mediocrity. They know when to step in and when to let go.
Great. So how do I communicate with my investors? What do they care about?
Consistency is the key. Typically, the earlier you are in your lifecycle as a company the more frequent the investor update. Companies going through an accelerator may be sharing weekly updates, whereas Seed/Series A are monthly, and Series B+ are quarterly.
Most early-stage investors care about a couple of key things:
1. Cash in the bank.
Cash is the oxygen of the business. Without it you die. This should be the metric that startups have their eye on. All. The. Time.
2. Months to 0.
This is how many months until you are dead. Typically your cash in the bank / net burn. You can get fancier and include hiring plans, etc but we like to keep it simple.
3. Key Metric Growth.
This is the growth of your “true north” metric. It could be MRR, it could be DAU, but this is the metric on which you define success. Afterall, PG said it best: Startup = Growth.
3. Team.
How is the team performing & who are you hiring. You can get a little more advanced here and report on the team composition, e.g. R&D vs Business vs Admin. You could also split our full time employees, part time, and contractors.
4. Asks
AKA how investors can help. Having explicity actions for you investors is the best way to leverage them. Saying “looking for intros to BD execs at CPG companies” will not get you anywhere. Saying, I need an intro to Mike Smith at Acme Corp will convert much better!
What investors really care about is how you are executing against your plan. Seeing that you have 4,500 MAU is great but how does that compare against the forecast?
Ultimately the format is up to you. We see companies put the “Asks” first alongside “Thanks” for those who helped from the prior update. Some include the new hires first.
Related Resource: Investor Relationship Management 101: How to Manage Your Startups Interactions with Investors
Obviously, we are biased, but Visible was built to solve the investor relations problem for startups. We easily allow you track, visualize and forecast your KPIs and provide a narrative to your stakeholders. Feel free to hit us up if you have any questions or sign up

founders
Metrics and data
Customer Acquisition Cost: A Critical Metrics for Founders
What is customer acquisition cost (CAC)?
Your customer acquisition cost is an important metric used to track your company’s success. It is the sum total of the amount that it takes your business to acquire a customer, including time from your sales representatives and marketing and advertising expenses.
The customer acquisition cost definition: the total cost it takes to bring a customer from first contact to sale. A couple of things that commonly contribute to customer acquisition cost are:
Advertising costs
Cost of your marketing team
Cost of your sales team
Creative costs
Technical costs
Publishing costs
Production costs
Inventory upkeep
Of course, when you think about it, it can take a lot to acquire a customer: you may be running dozens of marketing campaigns, have multiple sales departments, and an array of revenue channels. Luckily, your customer acquisition cost formula is going to be comparatively simple: it’s the amount that your company pays to acquire customers in total divided by the number of new customers gained during that time.
Why is customer acquisition cost important?
Over time, your CAC will also tell you whether it’s getting more difficult or easier to acquire new customers. You’ll be able to look at trends to see when acquiring customers becomes more affordable, and if there are specific seasons during which customer acquisition is more expensive.
By using this data, you can optimize your acquisition strategies, and analyze the strength of your business overall. If your customer acquisition costs are going up, that’s an indicator that your marketing and sales aren’t effective. If your costs are going down, your current strategies are working.
Customer acquisition cost is closely related to other metrics, such as customer retention, customer lifetime value, and average purchase price. When used in conjunction with other metrics, you should be able to formulate a clear idea of how your company is doing.
How do you calculate CAC?
If the combined efforts of your sales and marketing team, including any related advertising costs, is $5,000 a month, and you pull in 500 new customers every month, then the total cost of your CAC is $10 per customer: it’s that simple. The lower your acquisition cost, the better — and if your CAC is very low compared to your customer revenue, scaling upwards may be a good option.
Tracking your CAC tells you a lot about how your company is operating. If your customer acquisition cost is $100 but your average sale is $50, your business isn’t sustainable; those acquisition costs need to be reduced. If your CAC is $100 and your customer retention cost is $20, retention becomes very important. Likewise, if your customer acquisition cost is $100 and your customer retention cost is $150, your new customer acquisition is more important.
How do you improve customer acquisition cost?
The best way to improve your CAC is to eliminate expenses that are increasing your acquisition cost. We suggest taking a look at your data and determining what is working best for acquiring new customers. If you are running a paid AdWords campaign and sponsoring events that do not have any attribution to new customers, it may make sense to cut the sponsorship and continue to focus on your paid AdWords campaign.
However, you can improve your customer acquisition cost by improving all parts of the funnel. At the end of the day, the more customers you bring in the lower your CAC will be. This means that it may make sense to focus on conversion at lower parts of the funnel. A few concrete examples of how to improve your customer acquisition costs are laid out below:
Focus on improving related marketing metric
For example, let’s say that you are spending $1000 (with no other costs) and converting 3% of your 1000 website visitors to customers on a monthly basis. That means you are spending $1000 to attract 30 customers — or $33.33 to acquire a single customer. But let’s say we can improve conversion on the marketing site by updating copy, including new buttons, and building new content. Maybe our cost to make the changes goes up to $1200 but we are converting the 1000 visitors at 5%. That means you are spending $1200 to acquire 50 customers — or $24 to acquire a new customer. A huge boost from the $33.33.
That is obviously a very simple example with fixed expenses. It is easy to see how you can replicate that idea across your funnel. It may mean getting more website visitors or converting marketing leads to customers. No matter where it is, improving your conversions across the funnel is a surefire way to increase new customers and bring down your acquisition costs.
Enhance User Value
On the flipside, if you want to increase your customer acquisition costs (or spend more to find new customers), you need to make sure you are giving users value once they become customers. This might mean offering enhanced product offerings, resources, and a stellar customer experience.
Implement a Customer Relationship Management (CRM) & Tracking
As the saying goes, “you can’t improve what you don’t measure.” In order to improve your customer acquisition cost, you need to have the tools in place to track your acquisition efforts. One of the best ways to do this is by implementing a CRM and keeping the data clean and concise.
Customer Acquisition Cost (CAC) examples
Customer acquisition can vary greatly based on industry, geography, business model, and lifecycle stage. For example, the customer acquisition for a company with a higher contract value (let’s say B2b software) warrants being higher than a company with a lower contract value (let’s say a customer-facing app).
Depending on your business model and market there are many factors that can be included in your customer acquisition cost. On one hand, let’s say we have a B2B software company that costs $100,000 a year. With a high contract value, it means that there is likely a very specific customer that has a very specific problem. To uncover and bring these customers on to make a large investment it will make sense to spend more money to acquire them. This may mean highly targeted ads, hosting events, or having dedicated team members to bring them on onboard. Check out a few different examples below:
Example 1 — SaaS Company
For example, let’s say our SaaS company spent $12,000 on marketing efforts that ended up bringing in 100 customers. From here, you expect to spend $8,000 servicing customers over the next year. The CAC breakdown for this company would look like this:
CAC = ($12,000 + $8,000) = $20,000 / 100 customers = $200 CAC
Related Resource: Our Ultimate Guide to SaaS Metrics
Example 2 — eCommerce Company
Suppose we sell goods and spend $1,000 on marketing efforts and $1,000 on sales efforts. Combined, these efforts bring in 20 customers. The CAC would look like this:
CAC = ($1,000 + $1,000) = $2,000 / 20 new customers = $100 CAC
Related Resource: Key Metrics to Track and Measure In the eCommerce World
Example 3 — Real Estate Company
Our last example is for a real estate company. A new housing complex spends $50,000 on marketing efforts and $50,000 on sales to rent out 500 units. The CAC would look like this:
CAC = ($50,000 + $50,000) = $100,000 / 500 = $2,000 CAC
As you can see, customer acquisition cost can be a very subjective metric. Depending on your company and model it is important to understand what a reasonable CAC is for you. That is why we need to understand your customer’s lifetime value (more on this below).
Related Readings: What is a Startup’s Annual Run Rate? (Definition + Formula)
What does lifetime value (LTV) mean?
There’s a reason why many experts insist Customer Lifetime Value (we’ll use LTV for short) is the most important metric for your startup. The data points you gather for the LTV formula can help assess the overall health of your company. Not only does LTV provide insight into the long-term trajectory of your startup, but it also gives immediate insight into specific areas that need improvement. Knowing how valuable it is to gain each customer is essential.
Related Resource: Defining Customer Lifetime Value for Startups: A Critical Metric
Customer lifetime value quantifies the value of what the customer acquisition actually brought into the business. Without customer lifetime value, you know how much every customer cost to bring in, but you don’t know how much those customers were worth.
Why is LTV important?
LTV has a major impact on how you determine and justify customer acquisition costs to your investors. You don’t want your backers to worry that you’re paying huge marketing or sales dollars for customers that aren’t worth the investment. But for SaaS companies and any business relying on a recurring revenue stream or repeat customers, acquiring customers at an initial loss is a necessary component in the long-term success strategy.
Many raised questions around Salesforce’s share price when the company’s stock topped $128 in 2011 despite a P/E of 234. But Salesforce’s model is based on incurring high acquisition costs upfront in order to enjoy recurring revenue for years after. The LTV of each customer ultimately becomes a high multiple of the initial acquisition costs. As long as the company maintains a high retention rate, their long-term revenue works like an annuity.
I have very little doubt that in the early years of Salesforce, Benioff and Co. maintained trust with their investors by showing them a strong LTV model that projected massive value on the customers they were acquiring at a short-term loss. It’s impossible to justify large acquisition costs in marketing and sales if not. A solid LTV approach can alleviate any reactionary fears from investors when they see a string of months or years in the red and get everyone on board with the long-term focus of the company’s growth.
How do you calculate LTV?
Finally, it’s time to calculate LTV. If there is no expansion revenue expected for the customers, you can simple use this:
To get a clearer picture of LTV, also take into account your gross margin percentage. Here’s how the equation should look:
How do you improve LTV?
Finally, make sure to adjust your LTV when product improvements or retention efforts increase customer value. Especially for enterprise software companies that continuously add features and raise the annual subscription costs as a result.
You can also increase LTV by offering better customer service. Clients will stick around longer and pay more money when their questions are answered quickly and problems are solved. It seems so simple, but customer success can be one of the defining features of a success SaaS company. Reducing churn will really shine in your LTV formula.
Lifetime Value (LTV) examples
Lifetime value is the amount that the customer will spend with the business throughout their relationship with the business. Some companies only expect to see a customer once, or very infrequently, such as real estate firms. Other companies expect that a customer will come on a regular basis, such as restaurants. The lifetime value of a customer is going to rest primarily on how often the customer interacts with and purchases from the brand.
We constructed a model using annual revenue figures. Here’s a look at LTV that you can share with investors:
What does LTV:CAC ratio mean?
To make your cost to acquire is worth the lifetime value of the customer, it’s helpful to check the ratio between both. LTV:CAC ratio measures the cost of acquiring a customer to the lifetime value. An ideal LTV:CAC ratio is 3 (your customer’s lifetime value should be 3x the cost to acquire them).
Related Reading: Unit Economics for Startups: Why It Matters and How To Calculate It
Why is LTV:CAC ratio important?
As we mentioned above the ideal LTV:CAC ratio in the eyes of many investors and startups is 3. This means that the lifetime value of a customer is 3x the cost to acquire them. As we wrote in our SaaS metrics guide, “ratios closer to one mean that you need to trim expenses. On the other hand, too large of a ratio may mean that you could spend more to gain even more business.” However, a larger number is generally a good sign as long as your business continues to grow.
If your LTV:CAC ratio is closer to 1 (or less than 1) you have a serious acquisition problem. This means that you are spending far too much to acquire customers and likely have a large burn rate. There are instances where this is okay if it is part of your plan. For example, to penetrate a competitive market.
How do you calculate LTV:CAC ratio?
To make your cost to acquire is worth the lifetime value of the customer, it’s helpful to check the ratio between both. Here’s the equation:
Having around a 3:1 ratio of LTV to CAC will likely impress your investors. Here’s how that would look in the model:
If you want to use the model yourself and upload to your Visible account we’ve made a Google Sheets template that you can find here (make sure to check out the instructions tab).
How do you improve LTV:CAC ratio?
An LTV model is exactly what is says it is: just a model. After you project your retention rate percentage, your company has to hit those numbers–just as if it were a revenue or profit goals. Otherwise, good customers can quickly become a terrible loss if they don’t renew enough times to turn a profit.
The LTV exercise will help keep you on track and determine where your company might need to deploy additional resources to hit retention goals. If the percentage slips, it’s time to figure out why you users are leaving. Is this a product problem? Is customer service underperforming? Sticking to your LTV model will be the canary in the coalmine to know when retention is a problem area for your company and it time to solicit advice and help from your investors.
Related Resource: Pitch Deck 101: The Go-to-Market and Customer Acquisition Slide
LTV:CAC ratio examples
In general, a good lifetime value (LTV) to customer acquisition cost (CAC) is 3:1. If a customer is being brought in for $100, their lifetime value should be at least $300. Otherwise, you will be spending too much drawing in your customers; it will become important to fine tune, streamline, and optimize your marketing and your advertising.
A ratio of 1:1 is bad: you’ll only be breaking even on your customer acquisition cost, and your business may not be gaining any ground. However, ratios of 1:1 or even worse are frequently seen when a business is initially scaling. If a company is attempting to grow aggressively, it may be able to do so by sacrificing its LTV:CAC ratio. Ideally, once this growth has been achieved, the company will find it easier and more affordable to gain further clientele.
Customer acquisition cost benchmarks
Customer acquisition cost can vary quite a bit depending on the industry and company lifecycle. If a company is going to market for the first time, chances are that customer acquisition costs will be higher as they start gaining ground. Most importantly, the industry and business model will be of much significance when evaluating benchmarks for your acquisition cost.
As we mentioned above, “some companies only expect to see a customer once, or very infrequently, such as real estate firms. Other companies expect that a customer will come on a regular basis, such as restaurants. The lifetime value of a customer is going to rest primarily on how often the customer interacts with and purchases from the brand.” This means that your LTV and market will dictate what an acquisition cost is.
If you’re selling less frequently for larger contract sizes, a higher customer acquisition cost will make sense. If you’re selling more frequently to smaller contract sizes you will obviously need to keep your acquisition cost down to scale across the larger customer base.
Using data from Entrepreneur, we can put together a few benchmarks across different industries as shown below:
Travel: $7
Retail: $10
Consumer Goods: $22
Manufacturing: $83
Transportation: $98
Marketing Agency: $141
Financial: $175
Technology (Hardware): $182
Real Estate: $213
Banking/Insurance: $303
Telecom: $315
Technology (Software): $395
Related Reads: How To Calculate and Interpret Your SaaS Magic Number
Optimize your customer acquisition cost metrics with Visible
Discuss with your investors your strategy for improving LTV and CAC over time. You can justify prioritizing product or service investments if you can point to the value payoff as a result. As your company continues to grow you will want to continue to tweak and improve your acquisition costs and lifetime value.
In an age where investors are more focus on profitability and sustainability than ever before one of the first places to look is your CAC and LTV. To get started with your LTV:CAC model, check out our free template below:
Unlock Your Investor Relationships. Try Visible for Free for 14 Days.
Start Your Free Trial